IP SLA Monitoring
The IP SLA page (see figure below) displays the lists of IP SLA operations that are configured on your Cisco devices. More specifically, this page displays the lists of IP SLA categories (e.g., HTTP, DNS, UDP Jitter, FTP, etc.) and measurement operations within categories (source->destination items), as well as their current values, i.e., round trip times (RTT), etc.
IP SLA statistics can only be monitored on Cisco devices that are properly configured, provided that the IP SLA monitoring is enabled in the polling profile assigned to those devices in Net Inspector.
For more information on configuring IP SLA operations on Cisco devices, please consult the Cisco documentation
(e.g.: http://www.cisco.com/en/US/docs/ios/12_4/ip_sla/configuration/guide/hsoverv.html).
To open the IP SLA page, click the IP SLA tab, as shown in the figure below.
Figure: The IP SLA page in Net Inspector (single column view)
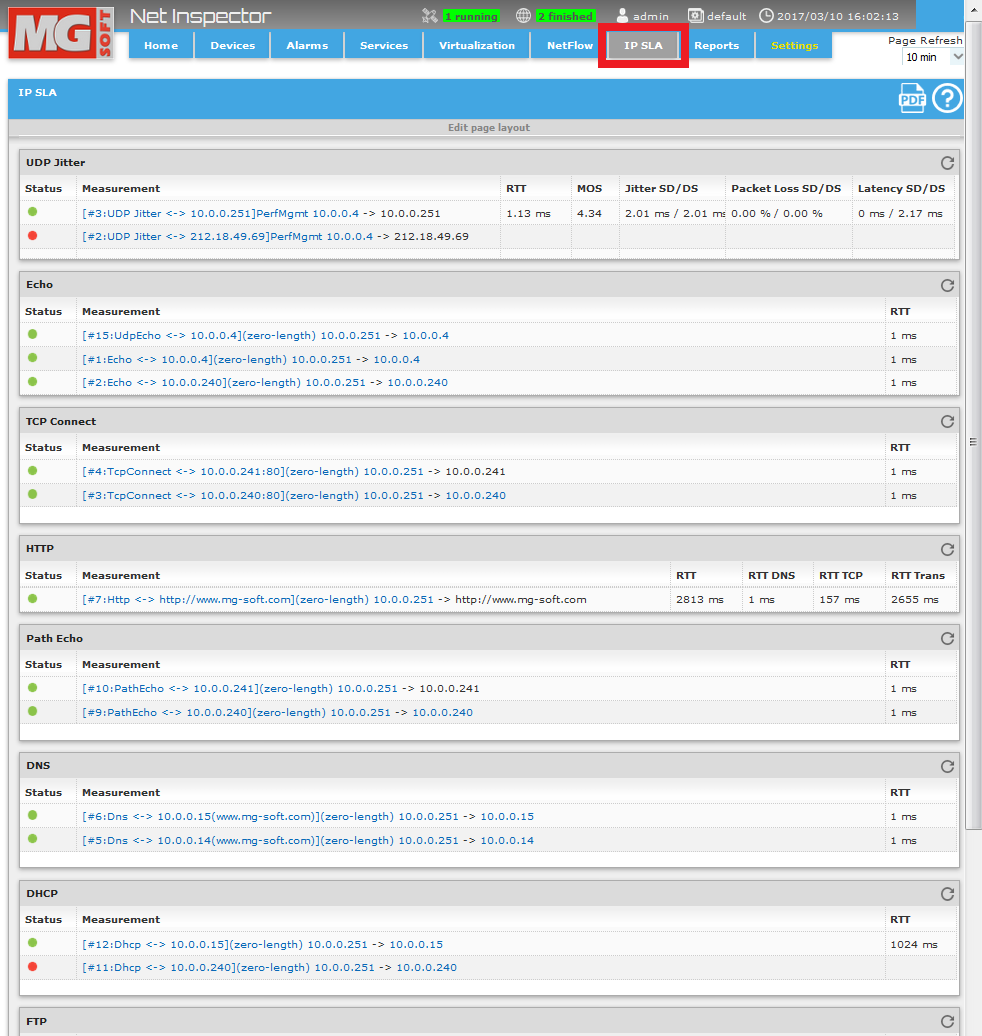
The IP SLA page displays the lists of monitored IP SLA categories in separate frames (e.g., UDP Jitter, HTTP, DNS, etc.), and IP SLA measurements (source->destination items) within categories, as well as the status of each measurement and the current and IP SLA measurement values, i.e., round trip times (RTT), etc.
To sort measurements within a frame by any column (e.g., Status, RTT, etc.), click the respective column header.
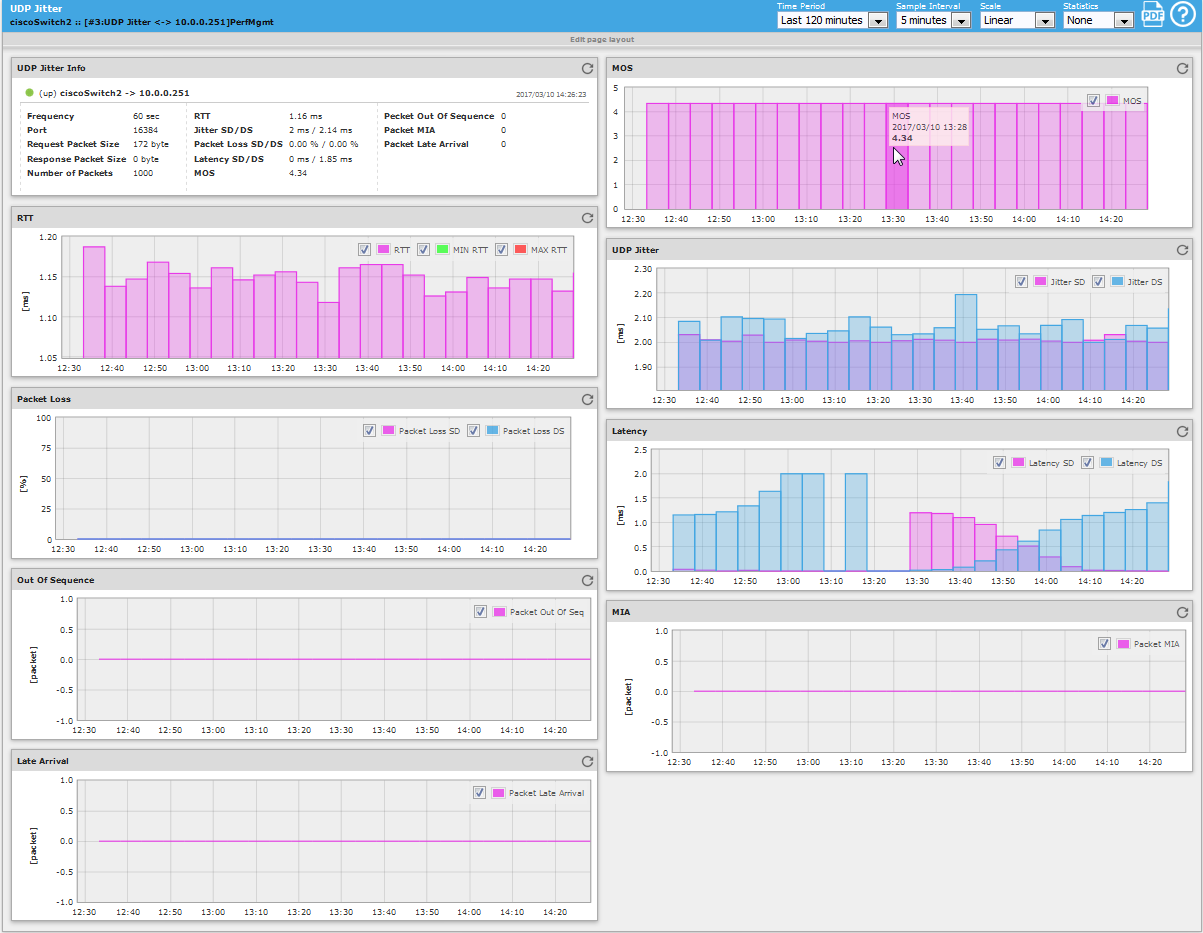
Click an IP SLA measurement operation in the first column (e.g., UDP Jitter), to view more detailed statistics with history for the given measurement operation. For VoIP, this includes the mean opinion score (MOS), round trip time (RTT), jitter, packet loss, latency, packet out of sequences, packet MIA, packet late arrivals and other IP SLA statistics (as shown in the figure below). For more information about those parameters, please consult the Cisco documentation that came with your equipment.
To view graphs for a different time frame or with a different sample interval, select desired entries from the Time Period or Sample Interval drop-down lists in the upper-right section of the titlebar (see the image below). Optionally, set a different scale (e.g., logarithmic) or enable displaying a trend line or a 95-percentile line (or both) on the graphs by selecting the relevant options from the Scale and Statistics drop-down menus, respectively.
Figure: Example of a web page displaying the IP SLA UDP Jitter for VoIP statistics
Click a graph to view more detailed statistics for the given metric (UDP Jitter, Packet Loss, Latency, MOS, etc.) in form of a graph and table. You can sort the table by any column. Use the pagination controls (next, previous, last etc.) at the bottom of the table to see other collected values in the given time frame.
Figure: Viewing Sourde->Destination and Destination->Source VoIP jitter history and zooming-in the graph
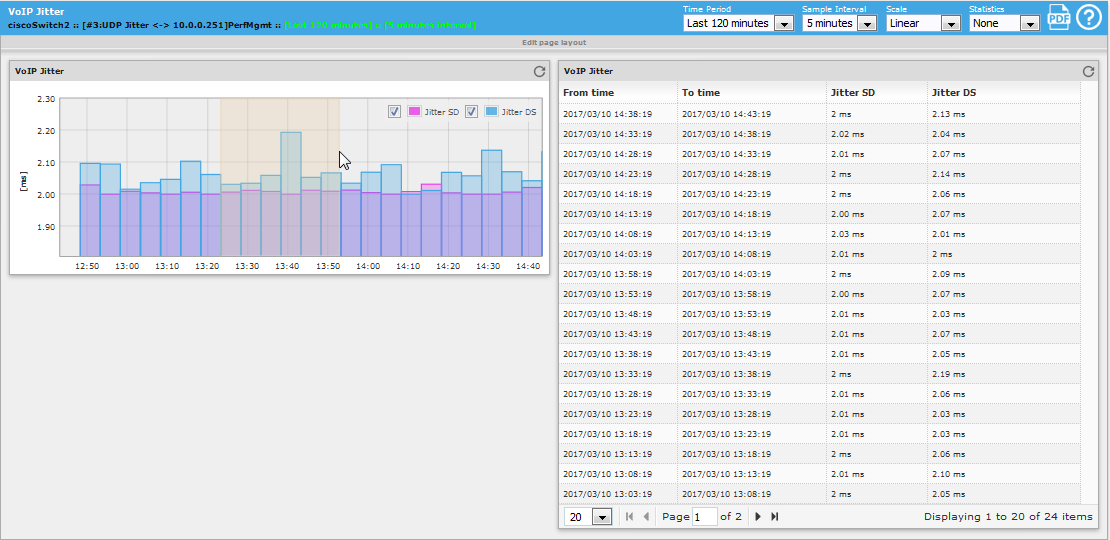
To zoom into a specific portion of a graph, select the desired portion of a graph with mouse (see image above).
Figure: Viewing a zoomed-in portion of a VoIP Jitter graph
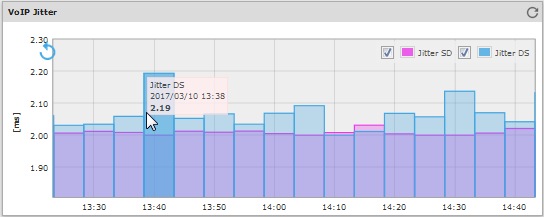
To zoom out the graph, click the Back button in the graph (
 ) or the Refresh
button in the graph titlebar (
) or the Refresh
button in the graph titlebar ( ) .
) .