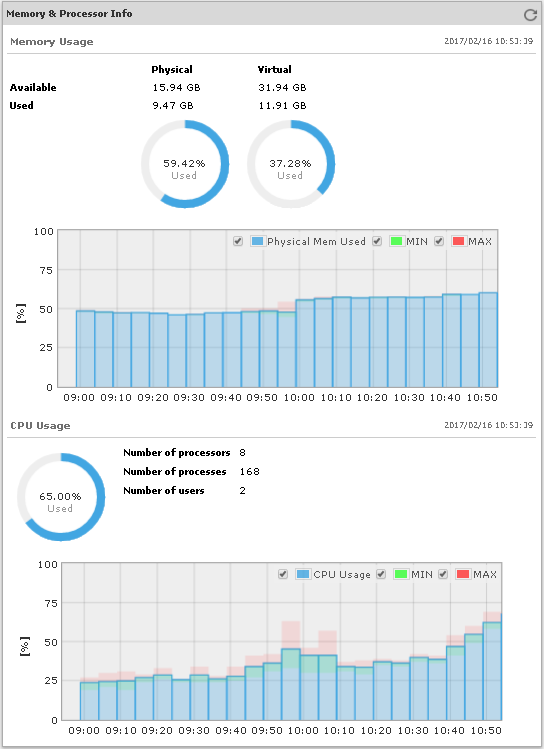
The Memory and Processor Info frame in the device performance page displays information about device resources and their utilization rates, i.e., physical and virtual memory size and usage, the number of CPUs, processes and users and the CPU usage.
A slightly different version of this frame is displayed for Cisco devices that are being polled via SNMP (i.e., it provides information about memory pools and their usage, as shown in second figure below).
The last-retrieved values are presented in circle charts. The history graphs are also shown for physical memory usage and CPU usage.
Figure: Memory and Processor Info frame in the device performance page
Figure: Cisco Memory Pools and Processor Info frame in the device performance page

Click on a graph to view history data (in form of a graph and table) for the given metric (e.g., CPU Usage), as shown in the figure below.
Figure: Viewing history graphs for a specific storage unit
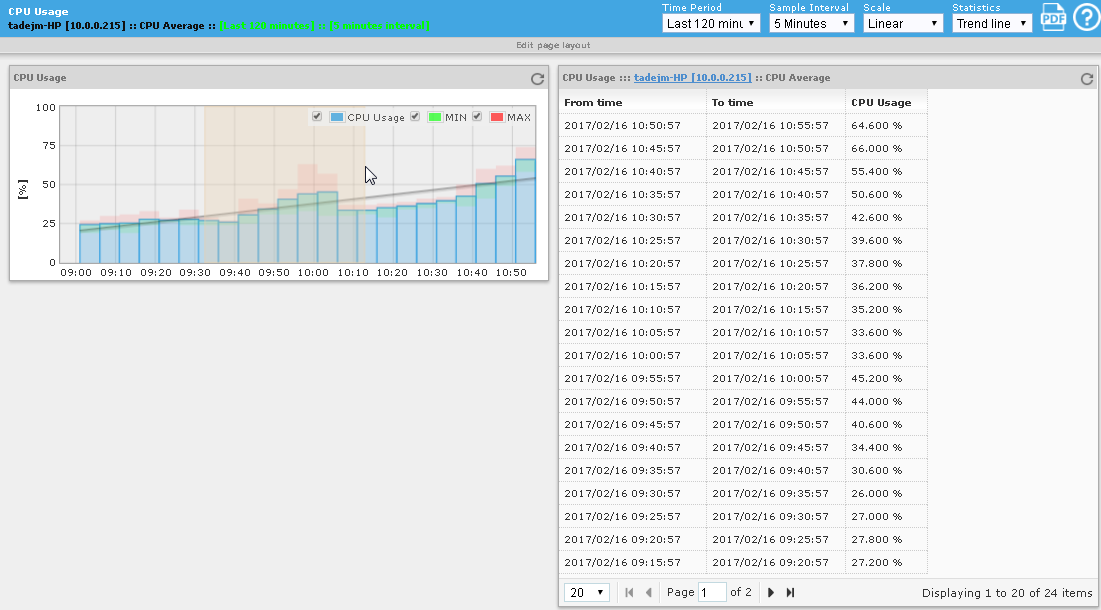
To view graph for a different time frame or with a different sample interval, select desired entries from the Time Period or Sample Interval drop-down lists in the upper-right section of the titlebar. Optionally, set a different scale (e.g., logarithmic) or enable displaying a trend line or a 95-percentile line (or both) on the graphs by selecting the relevant options from the Scale and Statistics drop-down menus, respectively.
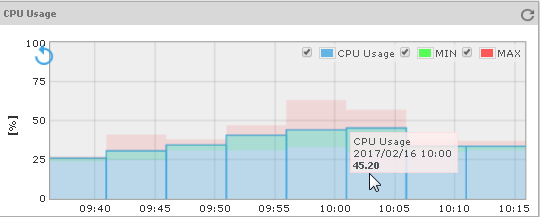
Hover your mouse cursor over any bar in a graph, to display the metric value and time in a tooltip.
To zoom into a specific portion of a graph, select the desired portion of a graph with mouse (see image above).
To zoom out the graph,
click the Back button in the
graph (![]() ) or the Refresh
button in the graph titlebar (
) or the Refresh
button in the graph titlebar ( ).
).
Figure: Viewing a zoomed-in portion of a CPU usage graph