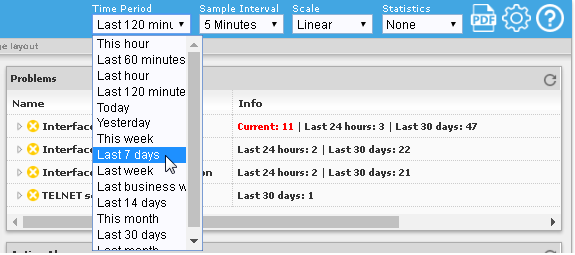
By default, Net Inspector displays values in graphs and alarm history for the last 120 minutes time period. To use a different time frame, select the corresponding entry from the Time period drop-down list in the device performance toolbar (e.g., Last 60 minutes, Yesterday, Last 7 days, Last 30 days, etc.).
Figure: Selecting a time frame from the Time Period drop-down list
All graphs in the device performance page will be updated to show variables for the selected time frame. Similarly, the Alarm History frame will show alarms that existed in the newly specified time frame.
The following entries can be selected from the Time period drop-down list:
Example: Current Date/Time: Tue, 2017/04/25 14:45:00 |
|
Example Start Date/Time |
Example End Date/Time |
|
This hour |
2017/04/25 14:00:00 |
2017/04/25 15:00:00 |
Last 60 minutes |
2017/04/25 13:45:00 |
2017/04/25 14:45:00 |
Last hour |
2017/04/25 13:00:00 |
2017/04/25 14:00:00 |
Last 120 minutes* |
2017/04/25 12:45:00 |
2017/04/25 14:45:00 |
Today |
2017/04/25 00:00:00 |
2017/04/26 00:00:00 |
Yesterday |
2017/04/24 00:00:00 |
2017/04/25 00:00:00 |
This week |
Mon, 2017/04/24 00:00:00 |
Mon, 2017/05/01 00:00:00 |
Last 7 days |
2017/04/19 00:00:00 |
2017/04/26 00:00:00 |
Last week |
Mon, 2017/04/17 00:00:00 |
Mon, 2017/04/24 00:00:00 |
Last business week |
Mon, 2017/04/17 00:00:00 |
Sat, 2017/04/22 00:00:00 |
Last 14 days |
2017/04/12 00:00:00 |
2017/04/26 00:00:00 |
This month |
2017/04/01 00:00:00 |
2017/05/01 00:00:00 |
Last 30 days |
2017/03/27 00:00:00 |
2017/04/26 00:00:00 |
Last month |
2017/03/01 00:00:00 |
2017/04/01 00:00:00 |
The Date/Time format is: YYYY/MM/DD HH:mm:ss
* Default time period