Viewing Predefined Reports
Net Inspector comes with a series of predefined fault and performance management reports (e.g., device availability, number of alarms per severity, network interface utilization,…) that are accessible out-of-the-box.
A user can select the desired time interval (a specific day, week, month, year, etc.) for any of the predefined time reports and view the results in form of a table. Time reports take into account all monitored devices in the current user view. Results can be filtered by using quick filters (as described below) and sorted by any column included in reports (e.g., device name, value, min. value, max. value, etc.).
All predefined reports, except NetFlow reports (which contain total values), contain average values for the selected time interval, and where applicable, also minimum and maximum values within this interval (e.g., Response Time report for one day contains the average response times for devices in the given day, as well as the absolute min. and max. device response times within that day).
Predefined reports (also called time reports) can be exported to PDF and CSV file formats for external viewing or post-processing.
This section describes how to select and view predefined time reports.
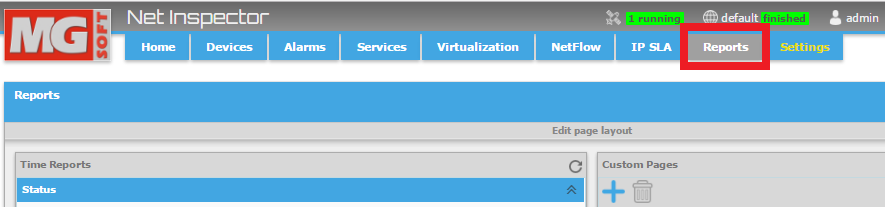
Click the Reports tab in the main window to display the Reports page (as shown in figure below)
Figure: Opening the Reports page
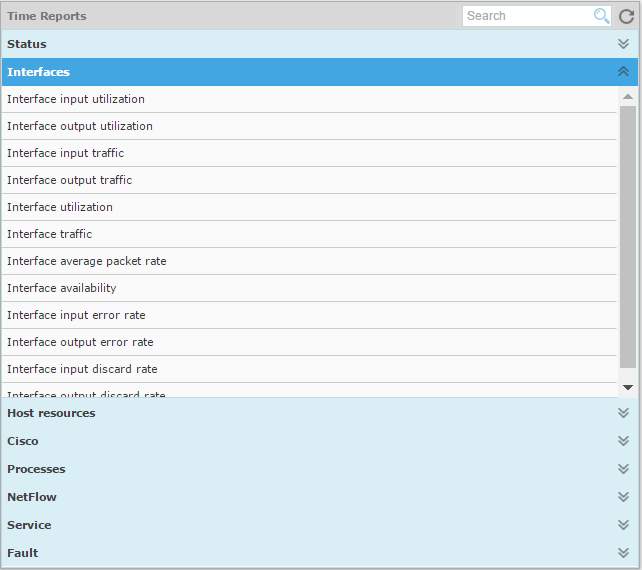
The Time reports frame (Figure) in the Reports page displays a list of predefined reports in different categories (e.g., Interfaces, Host resources, Services, etc.). Click a category to view all time reports that belong to it. Then, click the individual report within the category to open it. The categories are:
Status: device availability (reachability), response time and packet loss reports
Fault: fault management reports (number of alarms per severity, alarm duration and frequency, etc.)
Interfaces: network interface-related reports (input/output utilization, traffic, error rate, etc.)
Host resources: system resources usage reports (CPU, memory, storage volumes)
Processes: monitored processes reports (process running status, CPU usage, memory usage)
Services: service availability, service round trip time (RTT)
Cisco: Cisco-specific resources usage reports (memory, interfaces) and Cisco IP SLA-specific reports (round trip times for ICMP, HTTP, DNS, VoIP jitter, VoIP MOS, etc.)
NetFlow: NetFlow reports (TopN applications, transceivers, protocols, conversations or countries for the selected router (or all routers) and interface (or all interfaces))
Optionally, use the Search facility (
 )
in the right portion of the Time Reports frame to
quickly find the reports that contain the entered search phrase.
)
in the right portion of the Time Reports frame to
quickly find the reports that contain the entered search phrase.
Click the report you want to view in the Time Reports frame.
Figure: Selecting a predefined time report in the Reports page
The selected report is displayed for the current day (Figure). To view the report for a different time frame, select the desired category from the Time interval toolbar drop-down list (e.g., day, week, month, quarter, year, etc.), and optionally shift the time interval backward or forward by clicking the accompanying arrow buttons (
 )
in the toolbar. When the desired time interval for the report
is selected, click the Refresh
button (
)
in the toolbar. When the desired time interval for the report
is selected, click the Refresh
button ( ) in the Time
interval toolbar to update the report to display the data
for the new time interval.
) in the Time
interval toolbar to update the report to display the data
for the new time interval.
Figure: Viewing a predefined time report (Device Availability)
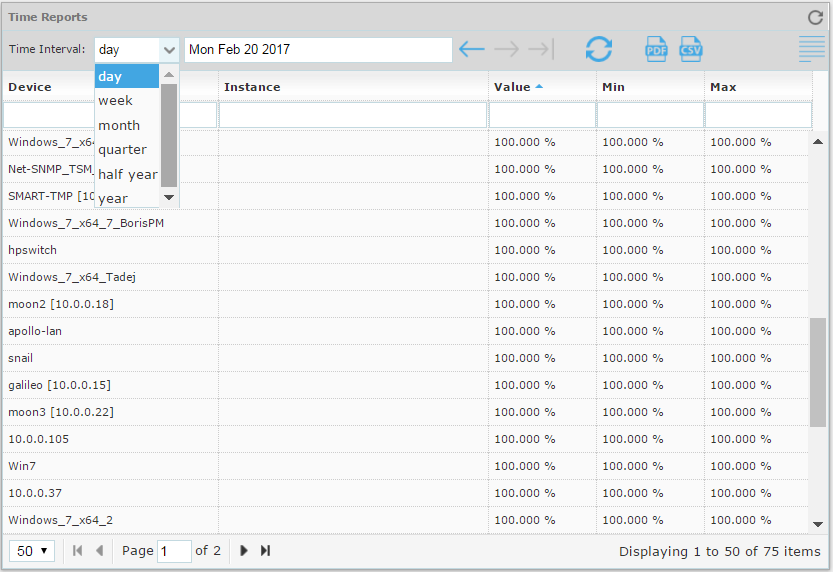
To display more or less entries in the table, select the desired number of entries (e.g., 10, 20, 50, etc.) from the pagination drop-down list in the lower-right section of the Time Reports frame. Use the Next / Last and Previous / First buttons in the pagination line at the bottom of the frame to view more entries.
You can sort the entries by any column (e.g., device name, value, min., max. value). To sort entries in ascending order, click the desired column header once (e.g., Device, Value, Min., Max., etc.). To sort in descending order, click the column header again.
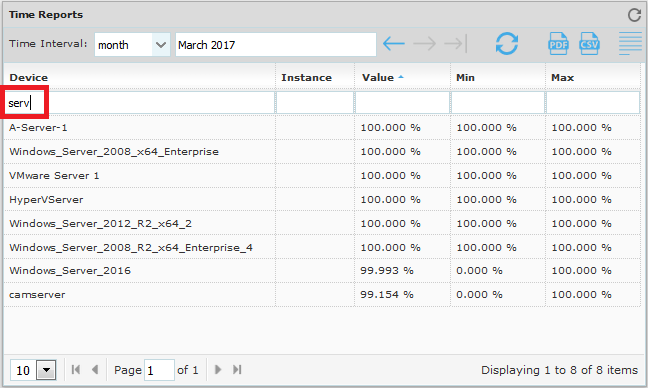
You can filter the results by using quick filters below the column headers. For example, to display only devices whose name contains the phrase "serv" (e.g., Server, webservice, etc.) enter the serv filter phrase into Device quick filter input line (as shown in the figure below). Note that quick filters are not case sensitive. To remove the filter, delete the filter phrase(s).
Figure: Using a quick filter in a predefined time report (Device Availability)
To export the displayed report to PDF or CSV (comma-separated values) file format, click the respective button (
 ) in the report
toolbar. A dialog that papers prompts you to save the report to
a file or open it. Select the desired option and click the OK
button.
) in the report
toolbar. A dialog that papers prompts you to save the report to
a file or open it. Select the desired option and click the OK
button.To close the displayed report and show the list of available time reports again, click the Show Reports button (
 ) in the report toolbar.