Editing Device Monitoring Options (General, Interfaces, Storage Units, Processes, Services)
By default, all network interfaces, storage units and network services are automatically monitored on devices. Processes are not monitored by default.
The Edit Device Monitoring Options dialog box lets you configure which interfaces, storage units, services and running processes on the given device will be monitored and which not, as described below.
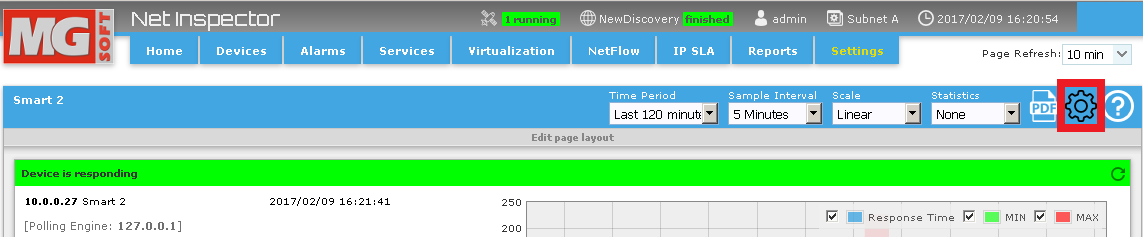
To select which interfaces, storage units, processes and services will be monitored on the given device (and thus the corresponding statistics included in the device performance page), click the Configure button in the upper-right corner of the device performance page titlebar (as shown in the figure below).
Figure : Choosing the Configure button in the device performance page
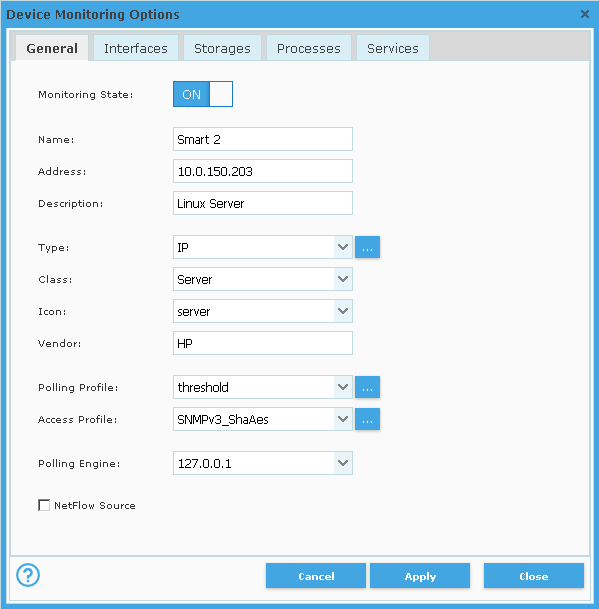
The Edit Device Monitoring Options dialog box is displayed, with the General tab selected, as shown in the figure below.
Tip: The General tab of the Edit Device Monitoring Options dialog box lets you view and edit the general device settings, such as device name, IP address, assigned polling profile, etc. For instructions on configuring the general device settings, please refer to the Adding Devices Manually topic.
Figure: Edit Device Monitoring Options dialog box, General tab
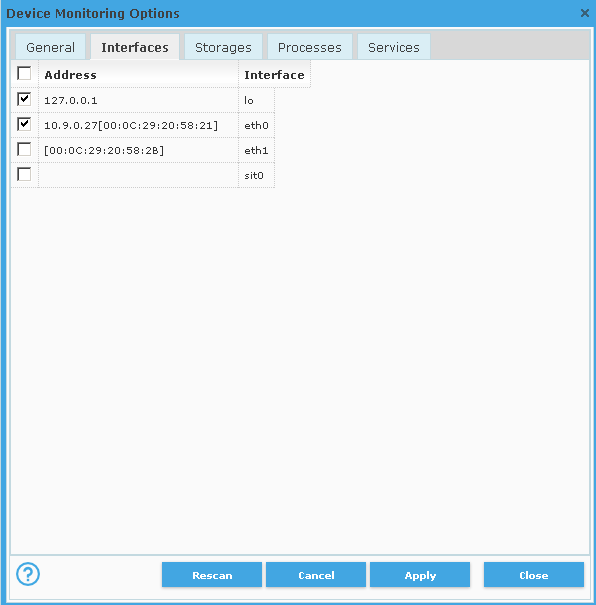
To enable monitoring one or more network interfaces, click the Interfaces tab in the Edit Device Monitoring Options dialog box and check the checkboxes in front of the interfaces you want to be monitored. To disable monitoring a specific interface, uncheck its checkbox in the Interfaces tab. Click the Apply button at the bottom of the Interfaces tab to apply the changes.
Figure: Edit Device Monitoring Options page - Interfaces tab
To choose the storage volumes to be monitored, click the Storage tab in the Edit Device Monitoring Options Monitoring Options page.
Figure: Edit Device Monitoring Options page - Storage tab
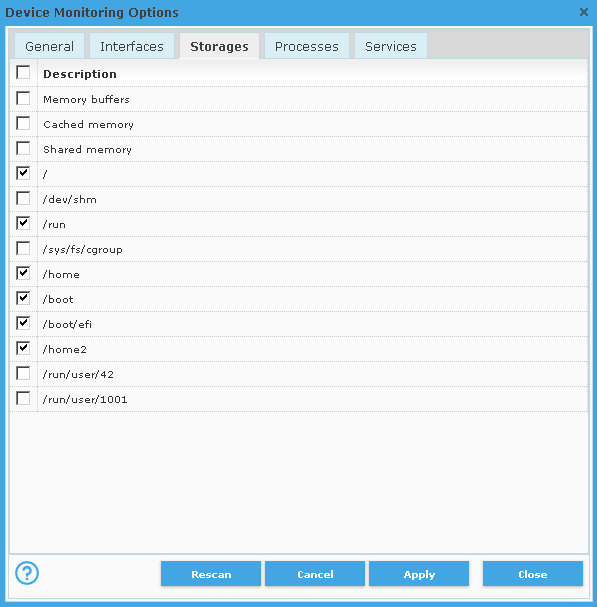
In the list of storage units in the Storage tab, check the checkboxes of the storage units you want to monitor on the given device, and click the Apply button.
To select the processes you want to monitor on the given device, click on the Processes tab.
Figure: Edit Device Monitoring Options page - Processes tab
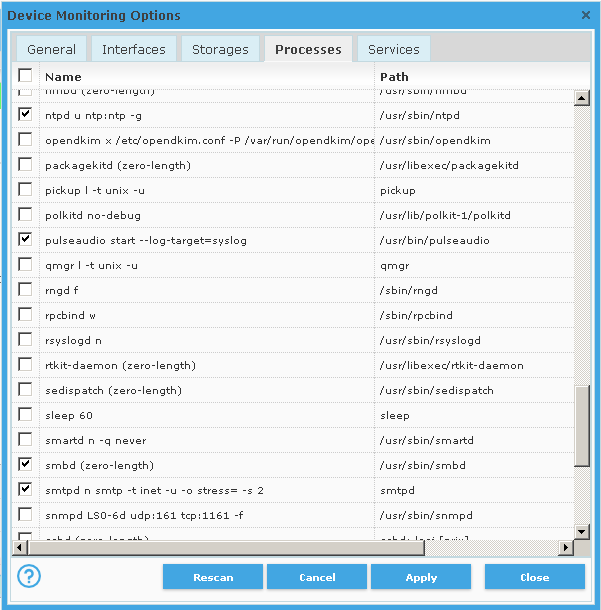
In the list of processes that run on the given device, check the checkboxes of the processes you want to monitor, and click the Apply button at the bottom of the Processes list. Optionally, click the Rescan button to rescan the device and display the current list of running processes.
To choose the network services you want to monitor on that particular device, click on the Services tab.
The Services tab lets you scan the well-known ports on the device for supported TCP and UDP network services. These services include HTTP, HTTPS, FTP, DNS, SMTP, IMAP, IMAPS, POP3, SSH, Telnet, NNTP, NNTPS, SIP, H.323, LDAP, LDAPS, IPP, LPD, MsSQL, MySQL and Oracle service. The Services tab lets you configure which of the detected network services will be monitored on the given device. Furthermore, in this view, you can configure to monitor supported services on non-standard ports. Once configured, the device Performance Statistics page displays the status of monitored services (i.e., whether the services are accessible or not).
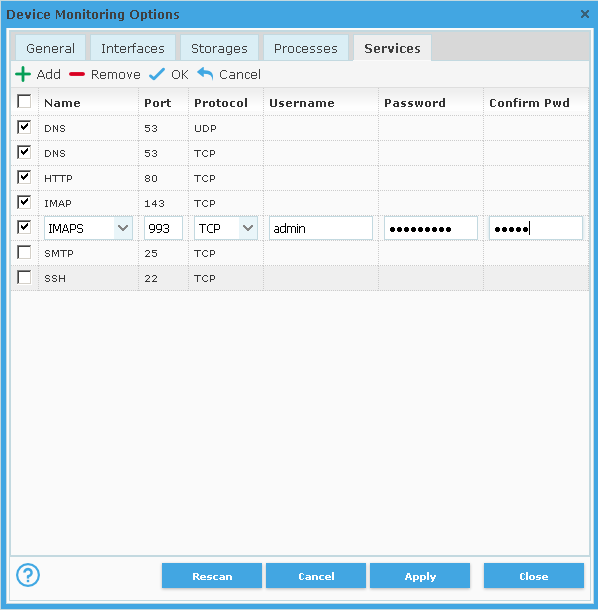
Check the checkboxes in front of the services you want to monitor. If user authentication is required for connecting to a service, double-click the respective service line and enter the username and password into the accompanying input lines and click the OK button above the Services list.
If there are no services listed, click the Rescan button to scan the device for supported services. To add a service that is currently not running on that device click the Add button, and choose the service from the Name drop-down list. Click the OK button above the Services list to finish adding a new service to the list.
Click the Apply button at the bottom of the dialog box to apply the changes.
After you have finished configuring the device monitoring options, click the OK button to close the dialog and apply the changes.