In addition to using the network discovery, import and auto configuration feature, one can add new devices to Net Inspector also manually, as described in this section.
Note: Only users with administrator access rights are permitted to add new devices to Net Inspector.
Click the Devices tab in Net Inspector header to display the Devices page.
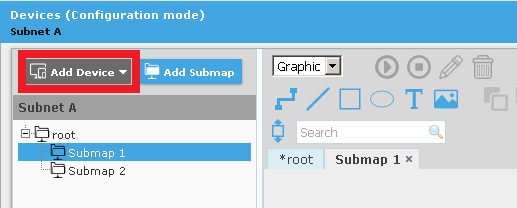
In the upper-right section of the Devices frame, click the Configure button to enter the Configuration Mode.
Figure: Switching into map Configuration Mode
![]()
In the Explorer section of the Map View frame, click the map, to which you would like to add a new device click the Add Device button, as shown in the image below .
Figure: Clicking the Add Device button (in map Configuration Mode)
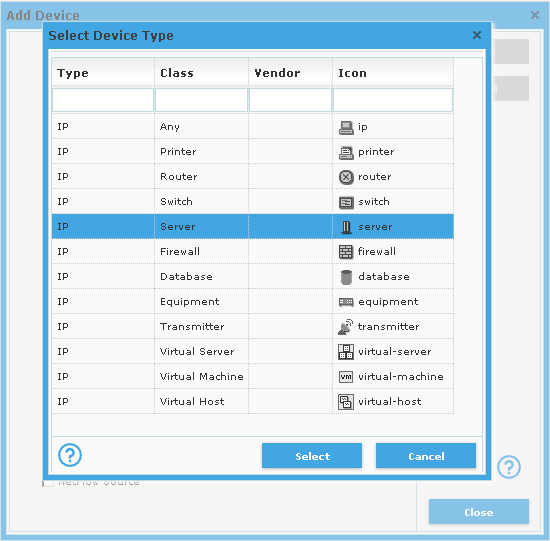
The Select Device Type dialog box appears, prompting you to choose the device type first. Select the type and class of device that best matches the device you are going to manage (e.g., IP server) and click the Select button.
Figure: Selecting the device type (from common IP types)
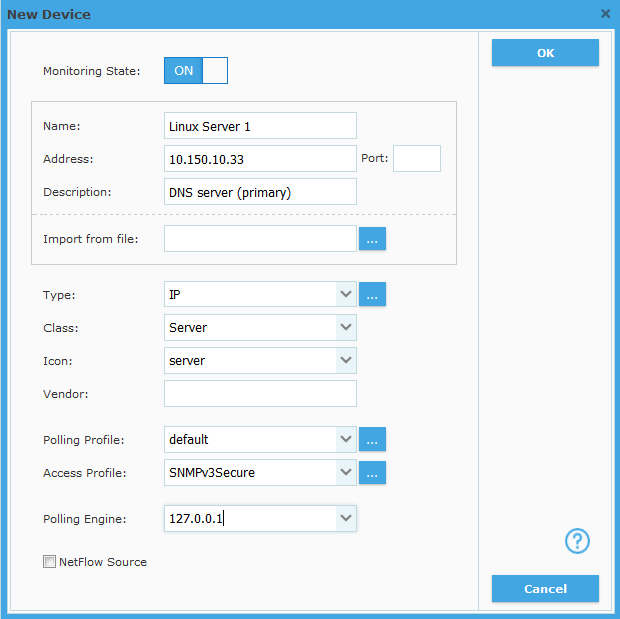
In the New Device dialog box that appears, specify the properties of the device you are adding, as follows:
Leave the Monitoring state switch in the ON state to enable device monitoring (after specifying the required device properties).
Into the Name input line, enter the name of the device, as it will appear in Net Inspector .
Into the Address input line, enter the IPv4 or IPv6 address or the fully qualified domain name of the device.
Into the Port input line, optionally enter the UDP port on which the device listens for SNMP requests. Note: You need to enter the port only if you want to use a different port than specified in the selected access profile. To use the port configured in the access profile, leave this input line empty.
Into the Description input line, optionally enter a short description of the managed object.
The Import from file input line lets you specify a CSV file, which device(s) will be imported from. For more information on importing devices refer to the Importing devices from CSV file section.
In the Type drop-down list, select the type of the device (e.g., IP).
In the Class drop-down list, select the class of the device (e.g., server, router, switch, virtual-server, etc.).
In the Icon drop-down list, select the desired icon for the device (e.g., server).
Into the Vendor input line, optionally enter the vendor of the managed device.
In the Polling profile drop-down list, select the polling profile to be used for polling the given device. A polling profile controls what parameters will be monitored, how often and what are the threshold values for triggering and clearing alarms. To create a new polling profile or edit existing ones, click the Browse (...) button next to this input line to open the Polling Profiles dialog box, where you can manage polling profiles.
In the Access profile drop-down list, select the access profile to be used for accessing the given device. An access profile contains credentials for accessing devices using supported protocols/methods (SNMP, WMI, VMware). To create a new access profile or edit existing ones, click the Browse (...) button next to this input line to open the Access Profiles dialog box, where you can manage access profiles.
In the Polling engine drop-down list, select the IP address of the Net Inspector polling engine that will be used for polling the given device (e.g., 127.0.0.1 for the local polling engine or the IP address of a remote polling engine - if installed).
If the given device will be sending NetFlow/sFlow packets to Net Inspector, check the NetFlow Source checkbox to enable receiving NetFlow/sFlow packets from this device in Net Inspector (device must be configured to send NetFlow/sFlow packets to Net Inspector by using a vendor-dependent mechanism - please refer to the vendor documentation for details).
Figure: Adding a new device - specifying device properties
After specifying all the discovery parameters, click the OK button at the bottom of the New Device dialog box to close it and add the newly configured device to the map (as shown in the image below). Note that the device is also added to the Device Panel. Net Inspector starts polling the device and listening for SNMP Trap and Inform messages sent by the device. If everything is configured properly, the status of the manage object changes from Unmanaged to Normal, i.e., the managed object icon background color changes from blue to green.
Figure: A new device added to a map (and to Device Panel)
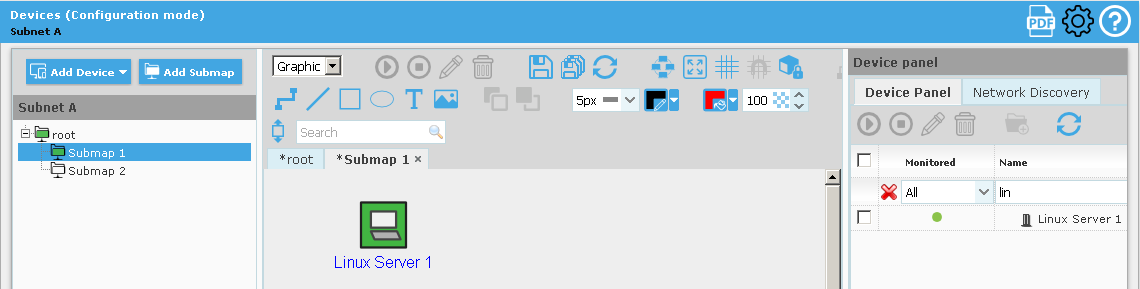
Note: When you add a device to Net Inspector and enable monitoring it, Net Inspector starts monitoring all network interfaces, storage units (disk partitions) and network services on the given device. You can modify which interfaces, storage units, services and running processes on the given device will be monitored, as described in the Configuring Device Monitoring Options topic.