Net Inspector lets you connect device icons in the Map View (Graphics mode) with connection lines that represent physical connections (links) between devices. Optionally, you can label a connection and its endpoints (e.g., to display the interface names or IP addresses). You can also select a network interface on one or both sides of the connection to display the interface nodes that represent the current status of the network interface used for the given connection.
Connection lines in Net Inspector visualize the current connection status (up or down) and traffic (data throughput and interface in/out utilization), as shown in the Viewing Link Status and Utilization topic. The status and traffic is shown only for connections between those objects that support SNMP MIB-II Interfaces table and for which the endpoint interfaces are known
This topic describes how to add connections to devices.
Note: Only users with administrator access rights are permitted to edit the maps.
Click the Devices tab in Net Inspector header to display the Devices page.
In the upper-right section of the Devices frame, click the Configure button to switch into the Configuration Mode.
Figure: Clicking the Configuration Mode button
![]()
In the Map View window, locate the device icons you would like to connect with connection lines.
Tip: If the map is currently displayed in the Details view, select the Graphics entry from the toolbar drop-down list to switch to the Graphics view.
In the Graphics
toolbar, click the Connection tool button (![]() ).
).
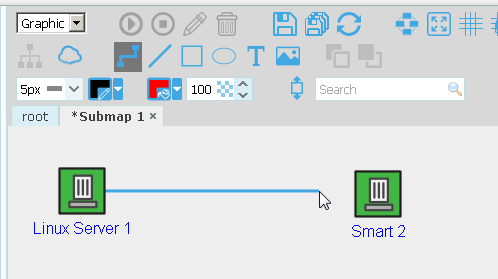
To add a connection line, click the first device icon on the map, move the mouse pointer to the second (target) device icon and click it, as shown in the figure below.
Figure: Connecting two icons with the Connection tool
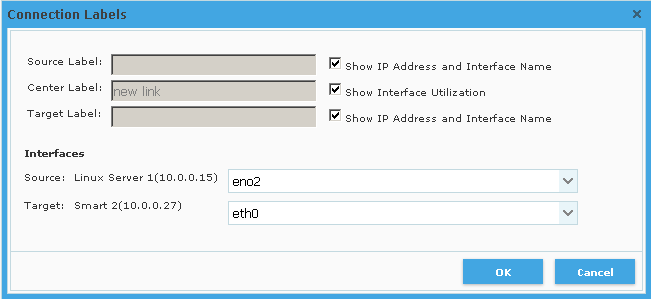
A connection line appears between the two icons and the Connection Labels dialog box (Figure) is displayed that lets you select the network interfaces used on both ends of the connection (if this information is available via SNMP) and configure the connection labels. A connection line can also have 3 labels: source, target and center label. Labels are used, for example, for naming the connection and its endpoint interfaces/addresses. To automatically show IP addresses and interface names in endpoint labels, check the Show the IP addresses and interface names checkboxes. Select the Show interface utilization option to enable displaying the interface in/out utilization as the center label.
Note: A connection endpoint network interface can be selected only if the corresponding device supports SNMP, if it implements the standard SNMP MIB-II interfaces table (ifTable), and if SNMP monitoring/Network interfaces option is enabled in the polling profile assigned to the device.
Figure: Selecting the connection endpoint network interfaces
If
you have selected a network interface on one or both connected devices,
a network interface status node (e.g.:
 ) appears at the corresponding end
of the connection line (as shown in the figure below). This symbol
represents the current status of the given network interface used
for the connection. The status can be either up
(
) appears at the corresponding end
of the connection line (as shown in the figure below). This symbol
represents the current status of the given network interface used
for the connection. The status can be either up
( ), or
down
(
), or
down
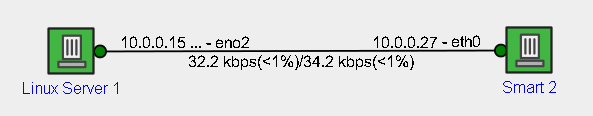
(![]() ). Furthermore,
the description of the selected interface automatically appears as
an interface label on the corresponding end of the connection line
(Figure 35).
). Furthermore,
the description of the selected interface automatically appears as
an interface label on the corresponding end of the connection line
(Figure 35).
Figure: A connection line with interface status symbols and connection labels
Repeat the procedure above to add additional connection lines to devices in the Map View frame, Graphics view. Connection lines enable modeling the physical and logical topology of the network (Figure).
When
finished, click the Configure
toggle button (![]() )
in the upper-right section of the Devices frame to exit the Configuration
Mode.
)
in the upper-right section of the Devices frame to exit the Configuration
Mode.