Click the Devices tab in Net Inspector header to display the Devices page (as shown in the figure below).
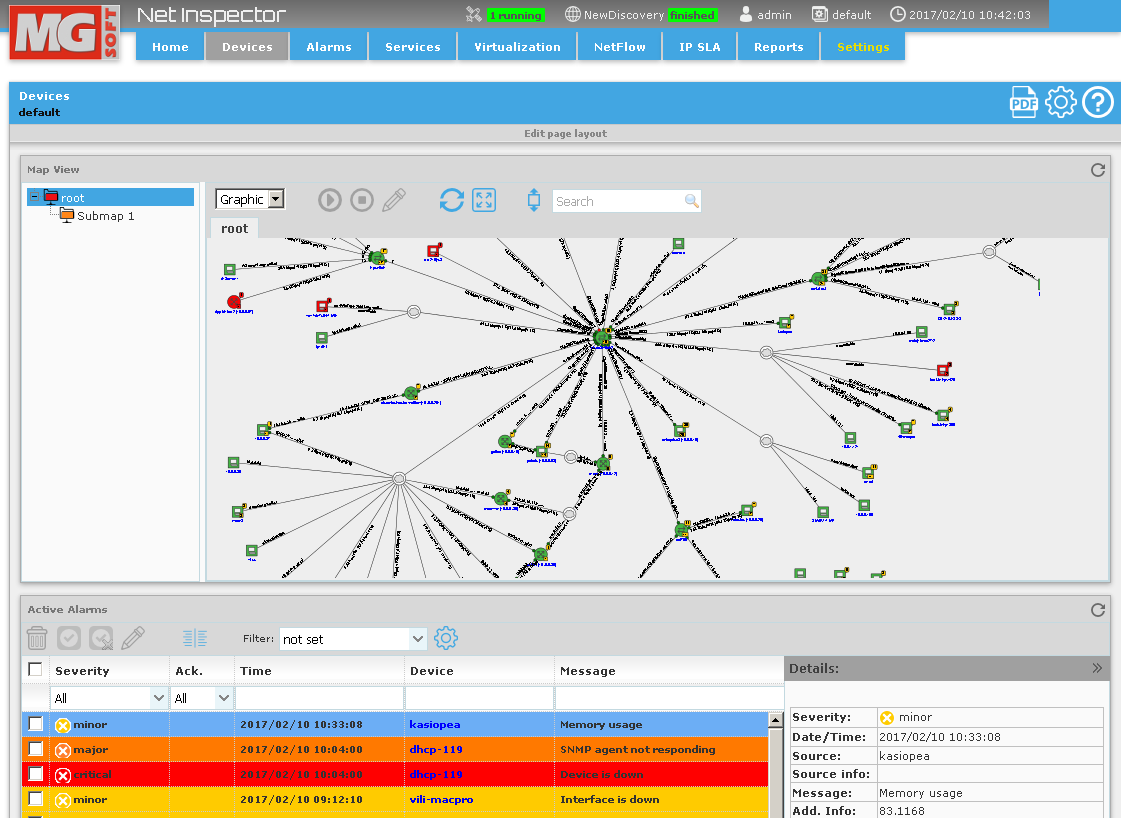
By default, the Devices page contains two frames:
Map View - displays and lets you configure devices, (sub)maps and graphic elements (lines, connections, rectangles, bitmaps, etc.).
Active Alarms - displays a list of all active (open) alarms on devices in the current user view, as described in the Active Alarms topic.
The Map View frame provides two views:
Graphics view - displays the contents of maps in a graphical manner, by showing device and submap icons, and optionally, graphic elements (lines, connections, rectangles, bitmaps, etc.).
Details view - displays detailed information about devices and (sub)maps in form of a table.
Both views also provide information about the current status of devices and active alarms, as described in the Information Provided by Icons on Maps topic.
The Explorer panel in the left portion of the Map View frame displays the Net Inspector user view structure. A user view can have a hierarchical tree-like structure of (sub)maps. Maps contain zero or more devices, submaps, and graphic elements (lines, connections, rectangles, bitmaps, etc.). Click a (sub)map in the Explorer, to view its contents in the main section of the Map View frame. Explorer panel also provides a quick overview of device statuses by propagating the color of the most severe device status up the hierarchical tree to the root map.
This section describes the principle of monitoring active alarms and object statuses in the Map View frame.
The Graphics view displays the contents of maps in a graphical manner, by showing device and submap icons, and optionally, graphic elements (lines, connections, rectangles, bitmaps, etc.). It also provides information about the current status of devices and active alarms, as described in the Information Provided by Icons on Maps topic.
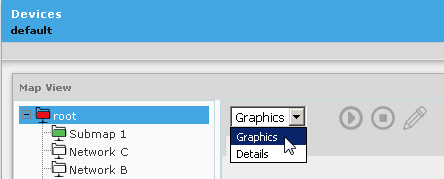
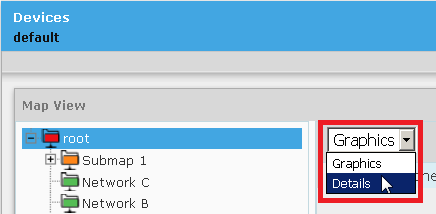
To enable the Graphics view, select the Graphics entry from the toolbar drop-down menu.
Figure: Selecting the map view (Graphics)
Open the map that contains the devices you want to monitor by clicking the relevant map in the Explorer section of the Map View frame.
Figure: Viewing the contents of a map in the Map View frame – Graphics view
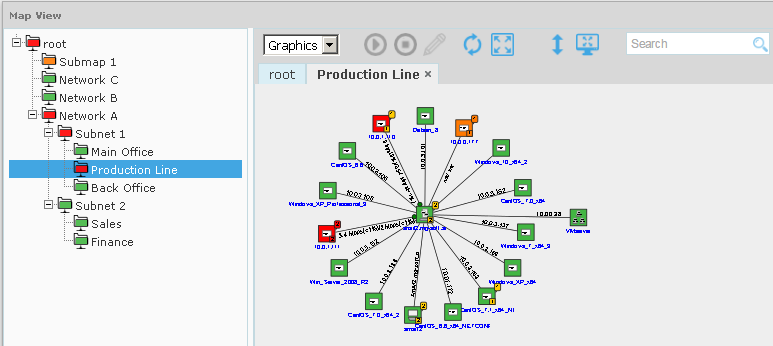
A new tab opens in the main section of the Map View frame, displaying the icons representing monitored devices and submaps (if any) contained in the selected map. The new tab carries the name of the opened map (as shown in the figure above).
Different device icons represent different types (classes) of devices (e.g., server, router, switch, virtual machine, etc.), as described in the Information Provided by Icons on Maps - Device Types topic.
A device icon color indicates the current status of the device, while the alarm balloons in the upper-right corner of device icons and alarm rectangles in the lower-right corner of device icons indicate the number and the highest severity of new and all active alarms, respectively, as described in the Information Provided by Icons on Maps topic.
Use your mouse wheel to zoom-in or zoom-out the map view. Click the Fit to screen button (
 ) to automatically adjust
the zoom level to display all devices on the map.
) to automatically adjust
the zoom level to display all devices on the map.To pan the view, right-click the map, hold down the right mouse button and drag the map in direction you wish to pan.
To set the height of the Map View frame to a fix value, click the Set window height button (
 ) and
enter the desired height in pixels in to the accompanying drop-down
list and click the OK
button to apply the changes and reload the page.
) and
enter the desired height in pixels in to the accompanying drop-down
list and click the OK
button to apply the changes and reload the page.To quickly find a device on the map, enter its name (or part of it) into the Search input line in the toolbar and press Enter. Net Inspector will select the matching devices and zoom into the portion of the map, as shown in the figure below.
Figure: Finding devices on the map

To view the contents of the map in full screen mode, click the Full screen mode button (
 ). This command displays
the contents of the map spread across the entire screen. In full
screen mode, you can still use your mouse to
zoom and pan the
map view. To exit the full screen mode, press the ESC
key or click a device name hyperlink.
). This command displays
the contents of the map spread across the entire screen. In full
screen mode, you can still use your mouse to
zoom and pan the
map view. To exit the full screen mode, press the ESC
key or click a device name hyperlink.To view the device performance statistics for a device, click the device name hyperlink below the relevant device icon to open the Device Performance Page in a new tab in web browser.
To view or edit the device properties (e.g., name, address, class, polling profile access profile, etc.) and device monitoring options (interfaces, storage units, processes, services), select the device icon on the map and click the Edit button (
 ) in the toolbar. This
opens the Edit
Device Monitoring Options dialog box. You can select more
than one device on the map by holding down the CTRL
button while clicking device icons or by making a selection with
the mouse (click and drag the mouse cursor to select a map area)
and then click the Edit
Device button to edit specific properties of all selected
devices at the same time (e.g., polling profile, access profile,
polling engine).
) in the toolbar. This
opens the Edit
Device Monitoring Options dialog box. You can select more
than one device on the map by holding down the CTRL
button while clicking device icons or by making a selection with
the mouse (click and drag the mouse cursor to select a map area)
and then click the Edit
Device button to edit specific properties of all selected
devices at the same time (e.g., polling profile, access profile,
polling engine).
To disable monitoring of one or more devices, select the device(s) on the map (by holding down the CTRL button while clicking device icons or by making a selection with the mouse) and click the Stop monitoring button (
 ) in the toolbar.
To enable monitoring of one or more devices, select the device(s) on the map (by holding down the CTRL button while clicking device icons or by making a selection with the mouse) and click the Start monitoring button (
 ) in the toolbar.
To make other changes to the map (e.g., reposition devices, add devices, remove devices, add text, images, connections, etc.), you need to switch into the map Configuration mode by clicking the Configure button (
 ) in the upper-right
section of the Devices frame.
) in the upper-right
section of the Devices frame.
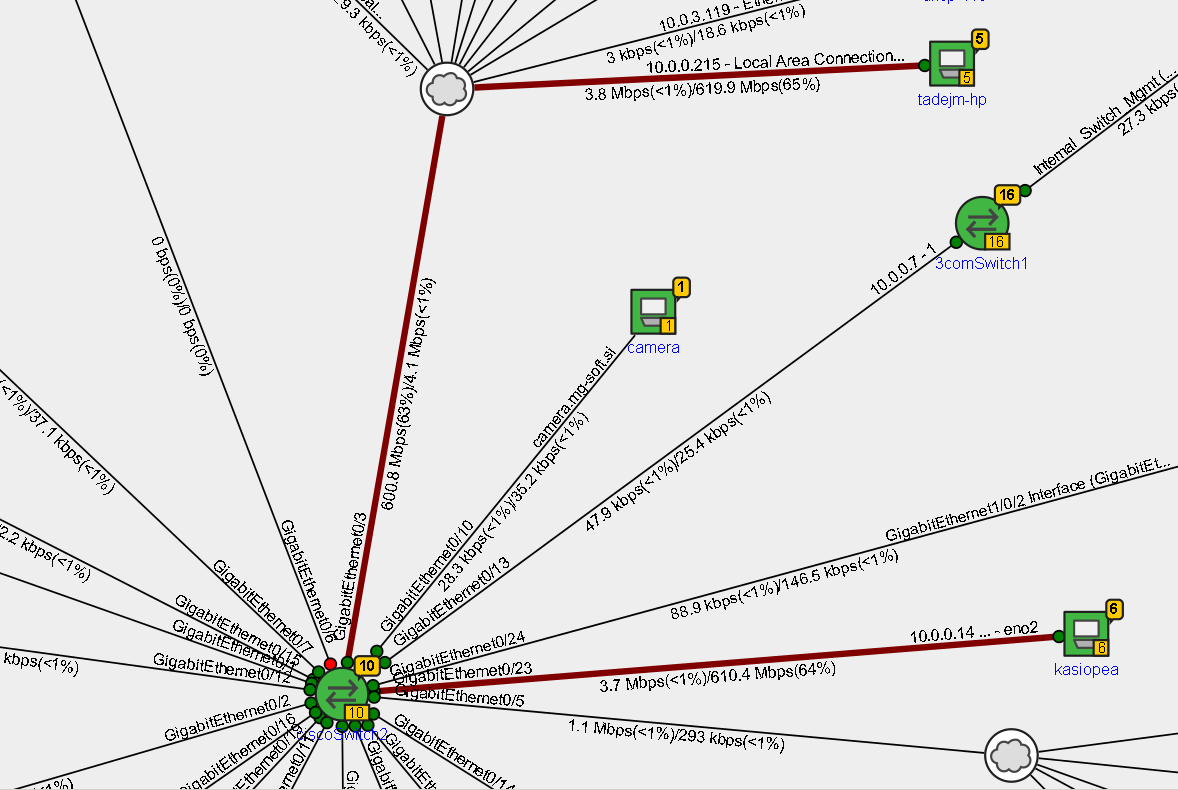
In the Graphics view you can view the current link status (up or down) and traffic information (interface in/out bitrate and utilization).
The width of a connection line automatically increases with increasing connection data throughput (the higher bitrate, the thicker the line) and its color automatically changes with increasing link utilization (black – low utilization, brown – moderate utilization, orange – medium utilization, dark red – high utilization). If a link is down, the color of the connection line is pure red.
The link status, bitrate and utilization is shown only for connections between objects that support SNMP MIB-II Interfaces table and for which the endpoint interfaces are known. Connection endpoint interfaces and labels can be configured in the Connection Labels dialog box.
Figure: Connection lines and labels provide information about the current network traffic
The Details view of a map displays information about devices and (sub)maps in form of a table. It also provides information about the current status of devices and active alarms associated with devices on the current map, as described below.
To enable the Details view, select the Details entry from the Map View frame drop-down menu.
Figure: Selecting the Details map view
Open the map that contains the devices you want to view by clicking the relevant map in the Explorer section of the Map View frame.
Figure: Viewing the contents of a map in the Map View frame– Details view
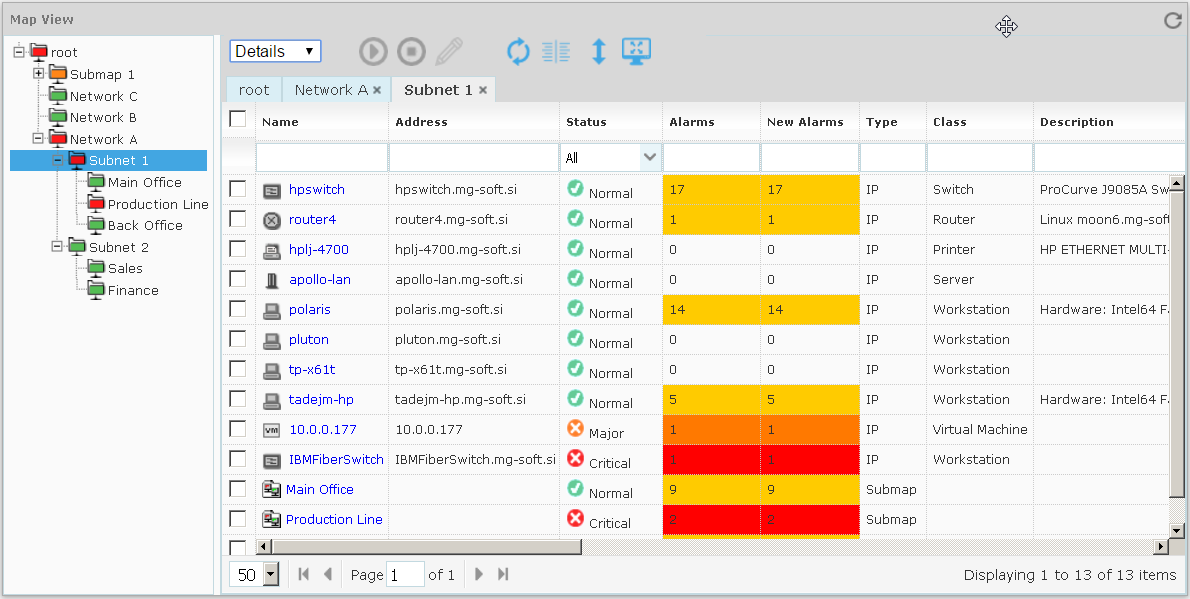
The Details view displays a list of all devices and submaps on the selected map. The following columns let you monitor the status of and active alarms on the listed devices (see also Information Provided by Icons on Maps topic):
Status
Displays the current status of the device. In case of a submap, this field displays the most critical status of the devices(s) included in the submap.
Displays the total number of active alarms on the device or the total number of active alarms on all devices in the submap (in case of a submap). This field reflects the color of the most severe active alarm that currently exists on the device (see alarm severity colors). In case of a submap, this field reflects color that matches the color of the most severe alarm that exists on the objects within the given submap branch.
Displays the number of new alarms on the device or the number of new alarms on all objects in the submap (in case of a submap). “New” alarms are active alarms, which are not acknowledged. The New Alarms field reflects the color of the most severe new alarm that currently exists on the device (see alarm severity colors). In case of a submap, this field reflects color that matches the color of the most severe new alarm that exists on the objects within the given submap branch.
To display or hide individual columns in the Map View frame - Details view , click the
 column
selector displayed in Map View toolbar and check or uncheck
the columns you want to display or hide, respectively.
column
selector displayed in Map View toolbar and check or uncheck
the columns you want to display or hide, respectively.To sort the list of devices by a particular column, click the relevant column header (Name, Address, Status, etc.). For example, to sort listed devices by their status, click the Status column header.
To view the device performance statistics for a device, click the device name hyperlink in the Name column to open the respective Device Performance Page.
To quickly find the devices of interest, use quick filters. All columns in the map details view have quick filter fields below the header row. Enter the desired text phrase into the respective quick filter filed (or select the desired entry for a quick filter drop-down list) to filter the list and display only the matching devices. For example, to find devices, whose name contains string "serv", type this string into the Name quick filter field. You can use two or more quick filter fields to achieve the desired filtering effect (combined filter criteria). Note that quick filters are short-lived, i.e., they are automatically removed when the page/frame is reloaded. For more details about using quick filters, please refer to the Managing Active Alarms topic.
To view or edit the device properties (e.g., name, address, class, polling profile access profile, etc.) and device monitoring options (interfaces, storage units, processes, services), select the corresponding device by checking the checkbox in the first column in the map details view and click the Edit Device button (
) in the toolbar.
This opens the Edit
Device Monitoring Options dialog box. You can select more
than one device and then click the Edit
Device button to edit specific properties of all selected
devices at the same time (e.g., polling profile, access profile,
polling engine). To disable monitoring of one or more devices, select the device(s) on the map (by checking their checkboxes in the first column) and click the Stop monitoring button (
) in the toolbar.To enable monitoring of one or more devices, select the device(s) on the map (by checking their checkboxes in the first column) and click the Start monitoring button (
) in the toolbar.To make other changes (e.g., add devices, remove devices, etc.), you need to switch into the map Configuration mode by clicking the Configure button (
) in the upper-right
section of the Devices frame.
See Also:
Information Provided by Icons on Maps