Viewing Device Performance Data
Detailed device performance statistics with history can be viewed in the device performance page, as described in this section.
To Open a Device Performance Page
To open the device performance page for a device, click the device name hyperlink anywhere in Net Inspector (e.g., on a network map, or in other frames or reports).
Figure: Clicking a device name hyperlink on a map
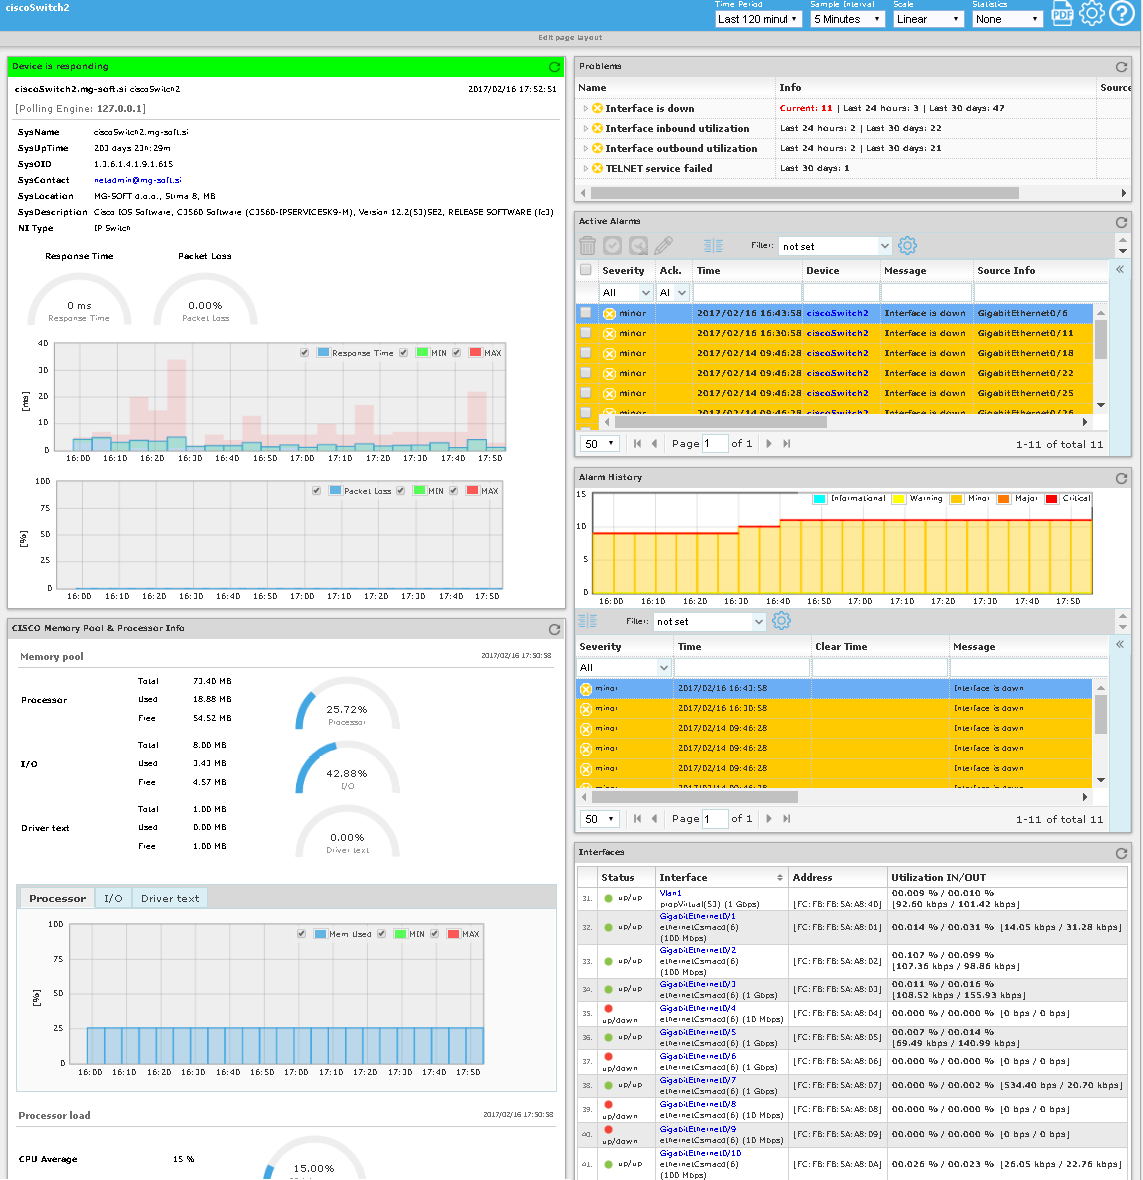
Device performance page appears, displaying the performance data, graphs and alarms for the given device (as shown in the image below).
Figure: An example of a device performance page (partial view)
About Device Performance Page
The contents (displayed categories) and the layout (order of categories, number of columns) of the device performance page can be customized to meet your preferences, as described in the Editing the Device Performance Page Layout section.
By default, the device performance page displays the following frames (categories of data):
Device basic information and device response time and packet loss.
Overview of current and past problems by alarm type.
Open alarms associated with the device.
History of alarms associated with the device.
Device memory usage and processor load.
Monitored logical disks/partitions (capacity, usage).
Monitored network interfaces (status, utilization, bitrates, packet rates etc.)
Monitored processes (path, PID, CPU and memory consumption)
monitored network services (status and latency (RTT))
IP SLA statistics: HTTP, DNS, Jitter, etc. (only on Cisco devices)
Guest virtual machines: status and alarms (only on virtual servers and hosts)
In addition to the above frames, Custom Statistics frames (which can be named arbitrarily - as specified in user-defined custom polling strategy) can be displayed in the device performance web page if enabled in the Edit Page Layout section.
Some of the fames above are populated only if a device supports collecting the respective metrics via the specified polling method (SNMP, WMI or VMware Web service) and if monitoring of these metrics is enabled in the polling profile that is assigned to the given device.
In addition to displaying the last retrieved device performance values, the device performance page shows also history graphs for the response time, packet loss, memory usage, and CPU load (where applicable). History data is shown for the selected time period (default: last 120 minutes), using the selected sample interval (default: 5 minutes). One can choose a different time and sample interval, , as described in the Setting Time Period and Setting Sample Interval topics. In addition, one can set the scale for graphs (linear or logarithmic), as well as enable displaying a trend line or a 95-percentile line (or both) in graphs, as described in the Setting Scale (Linear, Logarithmic) and Statistics topics, respectively.