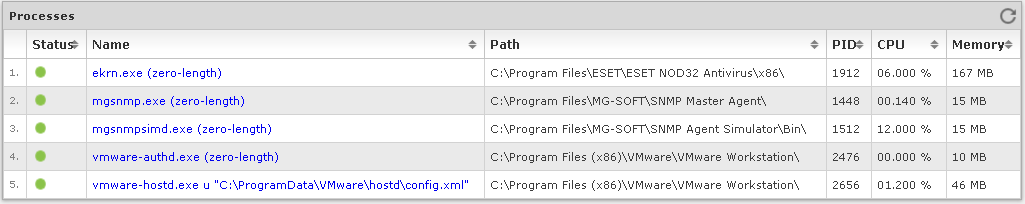
The Processes frame in the device performance web page displays a list of monitored processes, their current status, path, process identification number (PID), CPU load and memory usage. Processes can be monitored through SNMP or WMI.
One can configure which of the processes running on the given device will be monitored in the Edit Device page, Processes tab.
The following icons are used to indicate the current status of processes:
![]() -
Process is running
-
Process is running
![]() -
Process is stopped
-
Process is stopped
Figure: Processes frame in the device performance page showing monitored processes
By clicking a process in the list, you can view its detailed statistics in a dedicated web page. This includes the graphs for process status, CPU load and memory consumption.
Figure: Viewing history graphs for a specific process
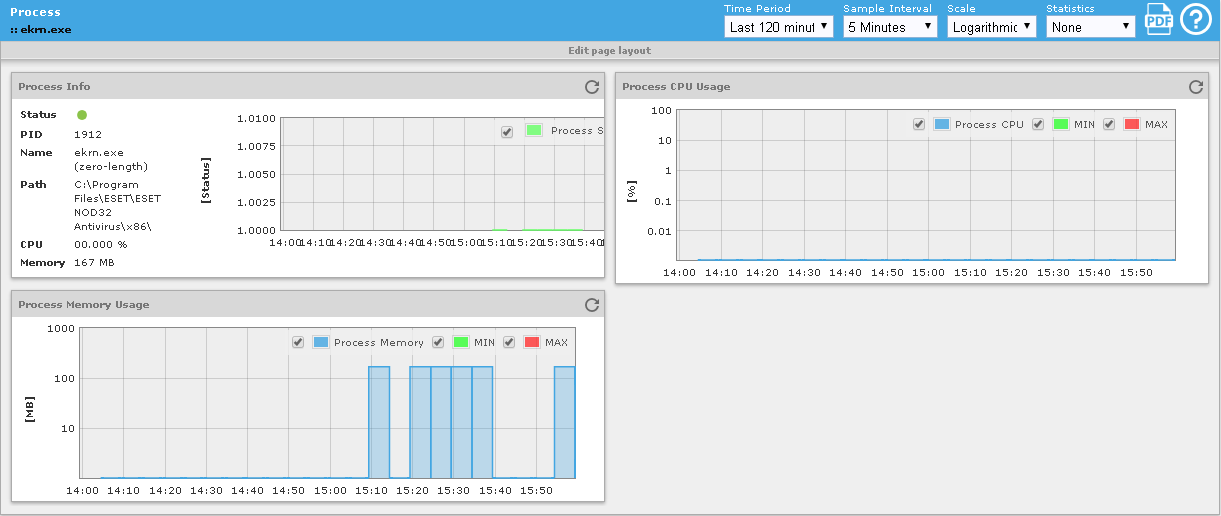
Click on a graph to drill-down to a web page with history data (in form of a graph and table) for the corresponding metric (e.g., CPU usage).