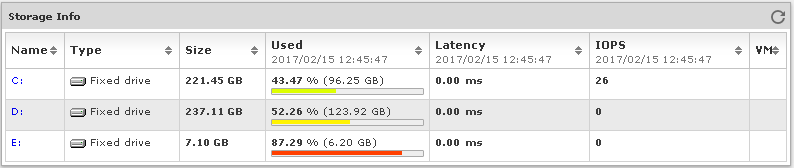
The Storage Info frame in the device performance page displays the monitored storage volumes (logical disks or partitions), their names, sizes and current usage. For devices polled through WMI or VMware web service, disk latency and IOPS (input/output operations per second) parameters are also shown.
One can configure which of the storage volumes of the given device will be monitored in the Edit Device page, Storage tab.
Figure: Storage Info frame in the device performance page
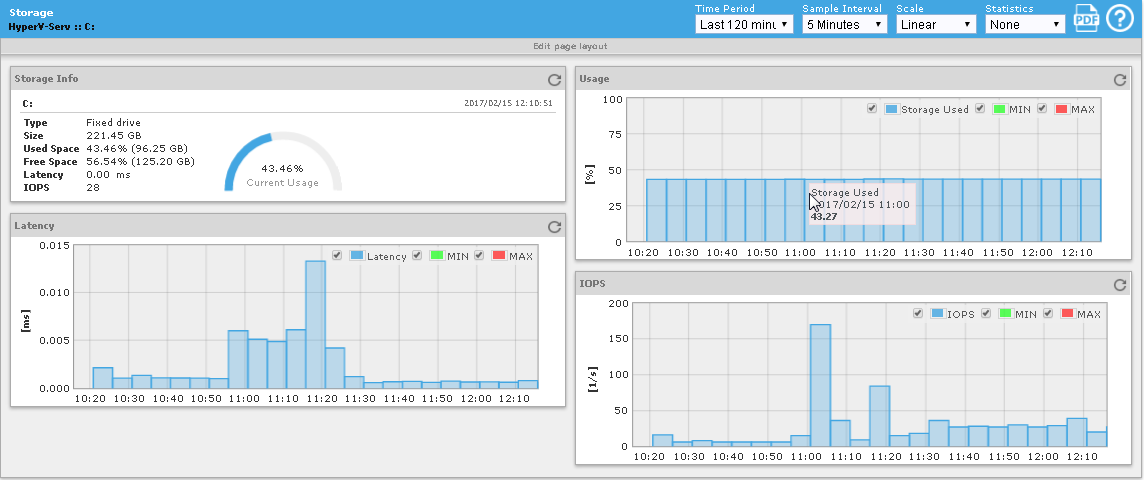
Click a disk name to view more details about its usage and performance history (as shown in the figure below).
Figure: Viewing history graphs for a specific storage unit
To view graphs for a different time frame or using a different sample interval, select desired entries from the Time Period or Sample Interval drop-down lists in the upper-right section of the titlebar.
Hover your mouse cursor over any bar in a graph, to display the metric value and time in a tooltip.
Click on a graph to drill-down to a web page with history data (in form of a graph and table) for the corresponding metric (e.g., Usage).
Figure: Viewing usage history graph and table for a specific storage unit
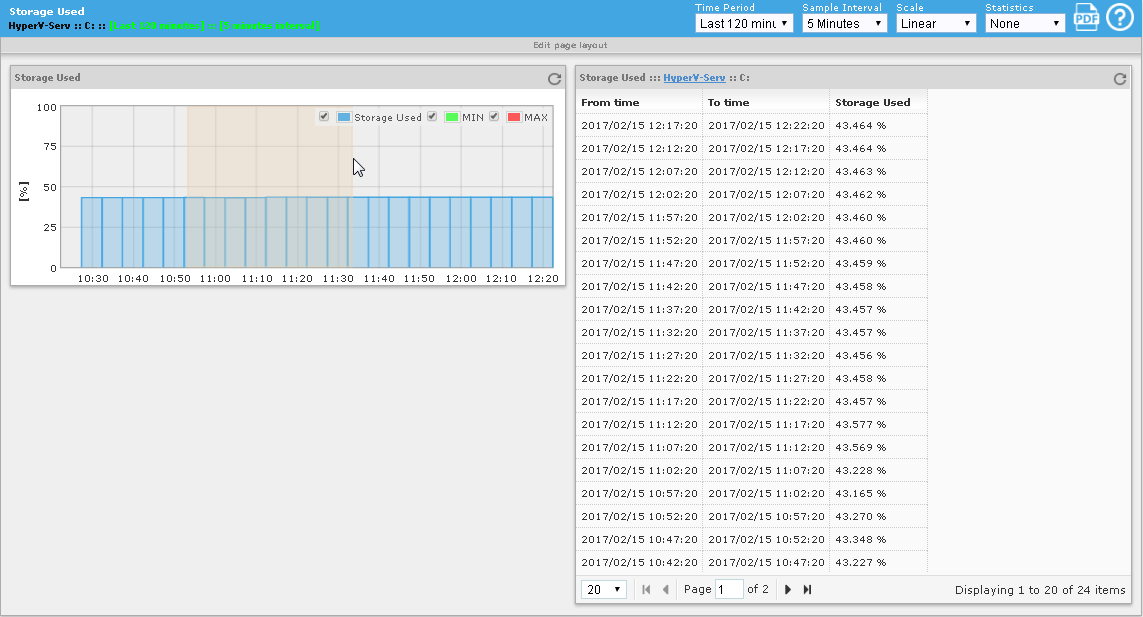
To zoom into a specific portion of a graph, select the desired portion of a graph with mouse (see image above).
To zoom out the graph,
click the Back button in the
graph (![]() ) or the Refresh
button in the graph titlebar (
) or the Refresh
button in the graph titlebar ( ).
).
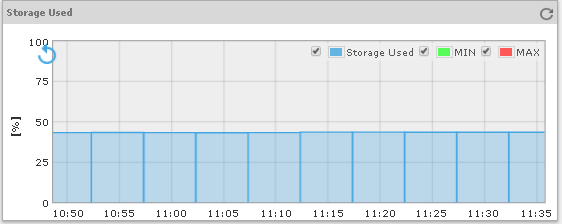
Figure: Viewing a zoomed-in portion of disk usage history graph