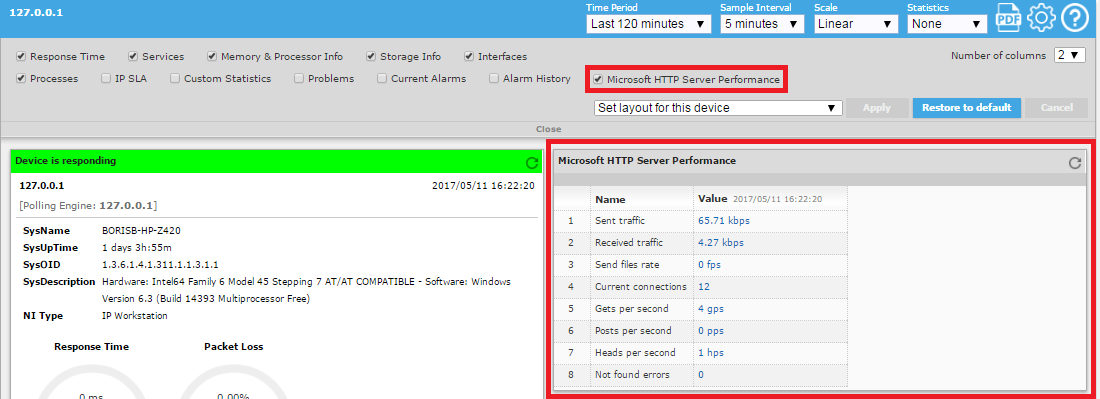
The Custom Statistics frame (which can be named differently - as defined in the custom polling strategy) in the device performance web page, displays the list of custom (user-configured) SNMP parameters and their collected values. The custom statistics (whatever its actual name) frame is not displayed by default. To enable displaying it, enable it in the Edit Page Layout drop-down frame (as shown in the figure below for the 'Microsoft HTTP Server' Performance custom statistics).
Figure: Custom statistics (Microsoft HTTP Server Performance) in device performance page
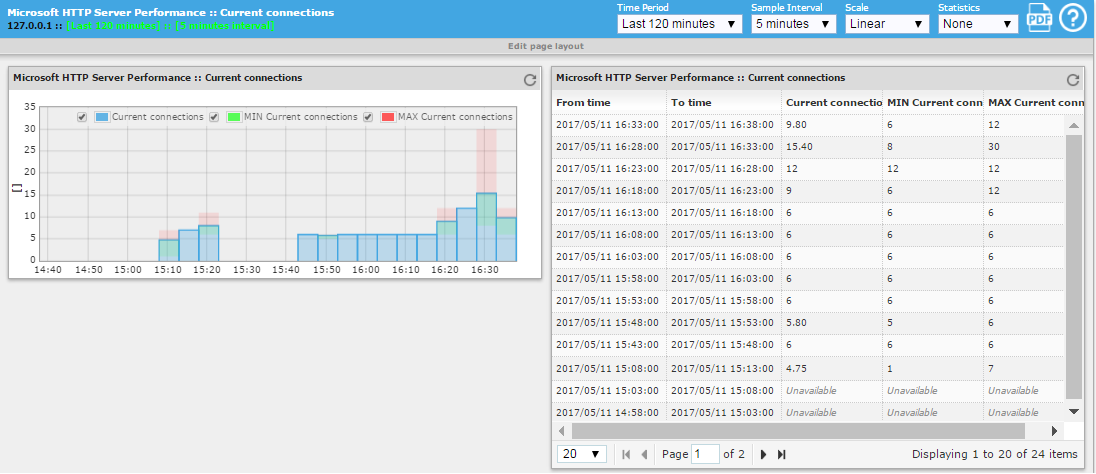
By clicking an item in the list of custom statistics, you can view more detailed statistics in a dedicated web page. This includes a table of retrieved values and a graph of retrieved numerical values of the user-specified SNMP parameters (see the figure below).
Figure: Viewing history graph and table for a specific custom metric (Current Connections)