Editing Device Performance Page Layout
By default, the device performance page contains frames for all standard categories of monitored parameters. Furthermore, the categories (Response time, Memory and Processor Info, Storage Info, Services, etc.) are displayed in 2 columns by default.
The device performance page layout (included frames, order of frames, number of columns) can be customized to meet your preferences. Note that besides the standard categories of reports (Response time, Memory and Processor Info, Storage Info, etc.), any other report available in Net Inspector can be added to the device performance page. The principle of adding such custom reports to the device performance page is the same as in custom report pages.
The modified layout can be applied to one device only, to all devices of the same type (e.g., server, router, firewall, etc.) or to all monitored devices in the system.
You can add the device performance page to quick link tabs displayed below the main header tabs in Net Inspector desktop in order to make this page easily accessible.
To Edit the Device Performance Page Layout
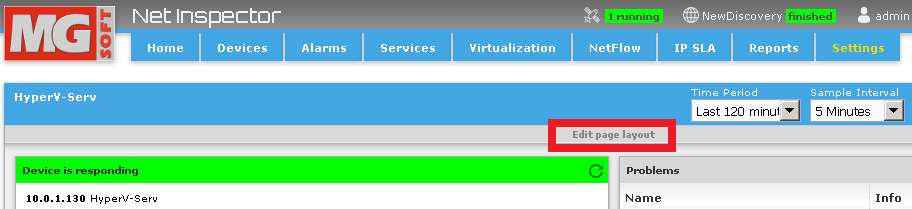
Open the device performance page of the device whose page layout you wish to customize by clicking a device name hyperlink on the Devices page.
Click the Edit page layout link below the titlebar of the device performance page (as shown in the figure below).
Figure: Selecting the Edit page layout link in the device performance page
The Edit Page Layout drop-down frame opens, as shown in the image below.
Figure: Opened Edit page layout drop-down frame in the device performance page
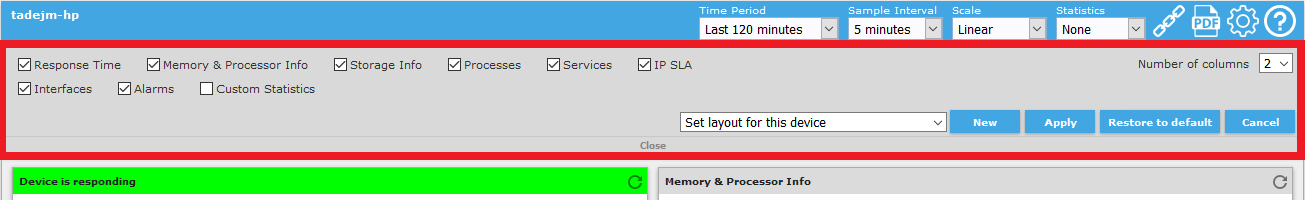
Check the checkboxes in front of the standard categories to be displayed in the device performance page. The following standard categories are available:
When you enable a category (check its checkbox), its frame is immediately displayed on the currently opened device performance web page. When you disable a category, its frame immediately disappears from the currently opened device performance page.
Note: An empty frame will be displayed if monitoring of the selected category of parameters is not enabled in the polling profile assigned to the given device or if the device does not return the data from this category.
To add any other report available in Net Inspector, click the New button (
 ) in the Edit
page layout frame.
This adds a new frame in configuration mode to the bottom
of the device performance page (see the image below).
) in the Edit
page layout frame.
This adds a new frame in configuration mode to the bottom
of the device performance page (see the image below).
Figure: A new frame in configuration mode has been added to the device performance page
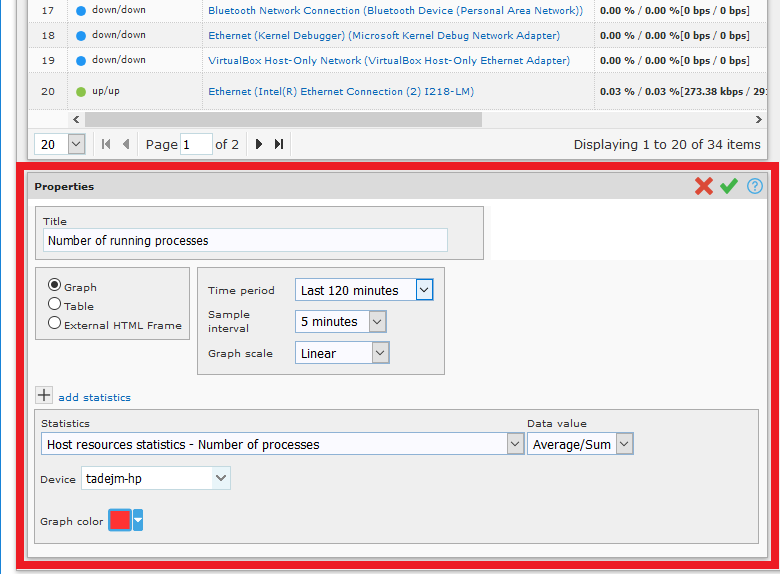
Enter the title of the new report and select the relevant entries in the Properties frame of the new report, as described in topic Creating Custom Report Pages, step 7.
Note: The Device drop-down list in the Properties frame of the new report automatically contains the name of the device, whose page you are editing and this cannot be changed (you cannot add a custom report for device B to the device report page of device A). Note also that if you add a non-standard report to the device performance page of device A and apply the new layout also to other devices (e.g., to device B, device C, etc. by selecting the Set layout for all devices or Set layout for all devices of the same type option), this report will automatically show the relevant metrics collected from device B when you open the device performance page of device B, etc.
After you have finished configuring the settings for the new report, click the OK button (
 ) in the Properties
frame to apply the settings and view
the newly configured report (as shown in the image below).
) in the Properties
frame to apply the settings and view
the newly configured report (as shown in the image below).
Figure: A new frame displaying the user-configured report in the device performance page
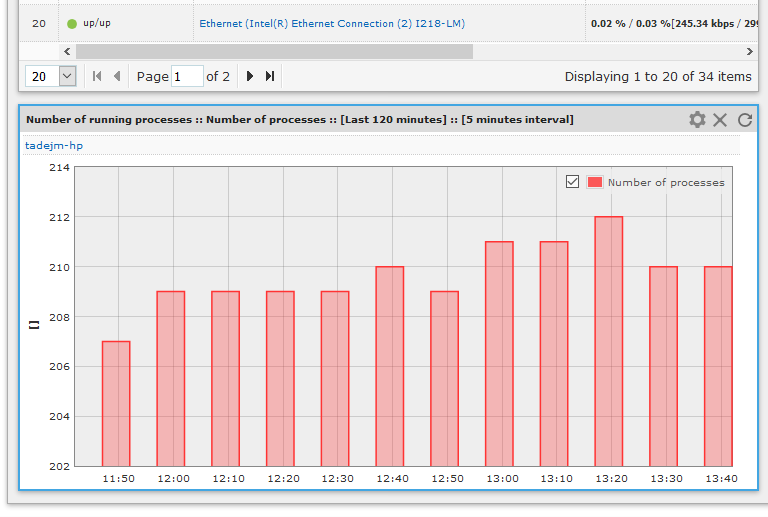
Notice a thin blue frame around the report that has been added manually. All reports that do not fall into the standard categories of reports have such frame, denoting they are "custom", user-added reports. Note that the Time period, Sample interval, Scale etc. settings that apply to all standard reports in the device performance page, do not apply to custom reports, as they already have these settings configured in their Properties frame. To change the settings of a custom report, click the Edit button (
 ) in its
frame titlebar to enter the report configuration mode (Properties
frame) and modify its settings. To remove a manually added report
from the device performance page, click the Delete
button(
) in its
frame titlebar to enter the report configuration mode (Properties
frame) and modify its settings. To remove a manually added report
from the device performance page, click the Delete
button( ) in its frame titlebar.
Frames in the device performance page can be displayed in 1, 2 or 3 columns. Select the desired number of columns from the Number of columns drop-down list in the Edit Page Layout drop-down frame (Figure).
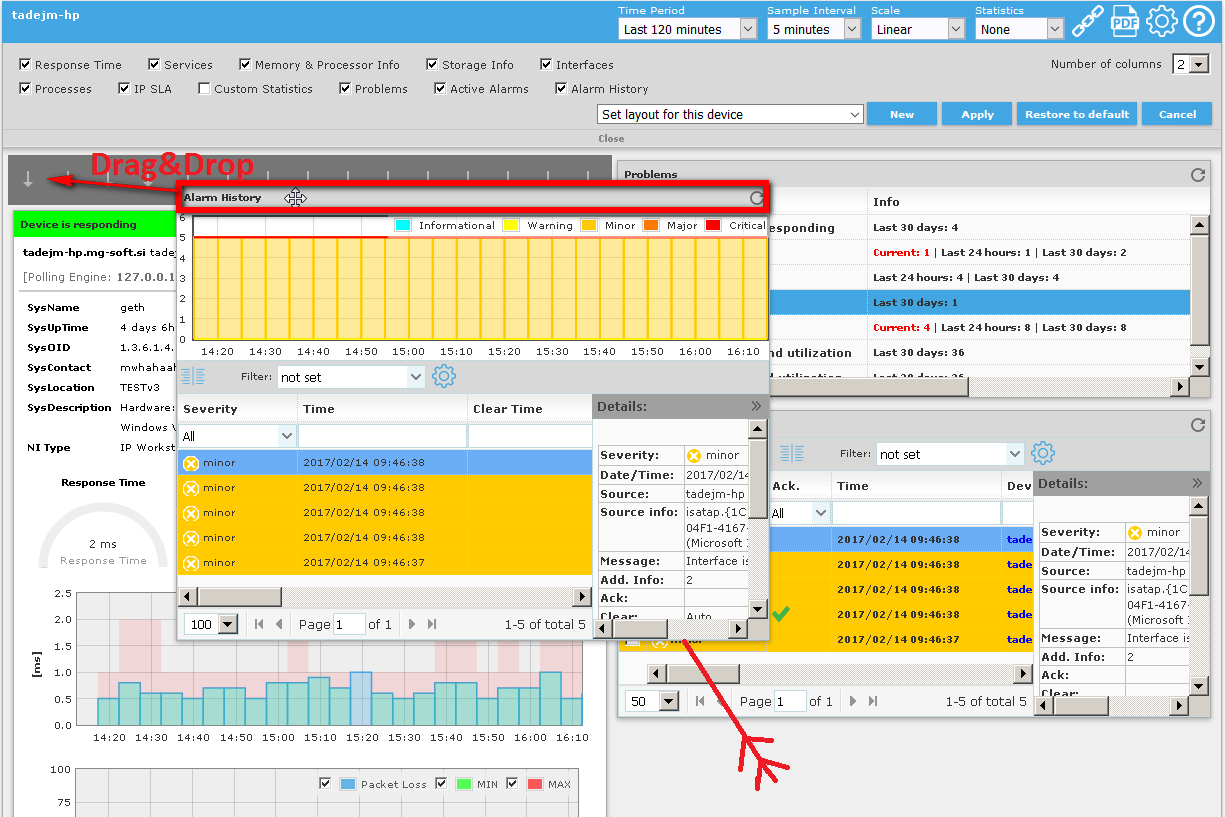
To move a frame to a different location in the device performance page, click the titlebar of the frame, hold down the left mouse button and drag the frame to the desired position. The shaded down-arrow markers appear at the location where the dropped frame will be placed (as shown in the figure below). Release the left mouse button to drop the frame to the marked position.
Figure: Repositioning a frame using the drag&drop technique
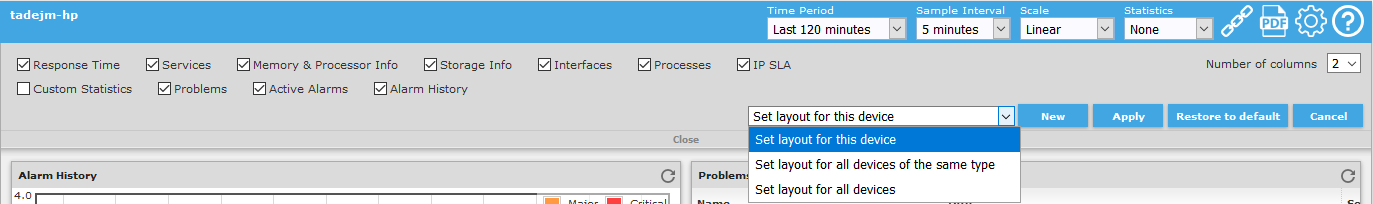
When you have finished editing the performance page layout, select the appropriate entry from the Set layout for… drop-down list and click the Apply button next to it to apply the configured layout to the selected device only, to all devices of the same type or to all devices in the system, respectively (as shown in the image below).
Figure : Applying the new page layout to the selected device
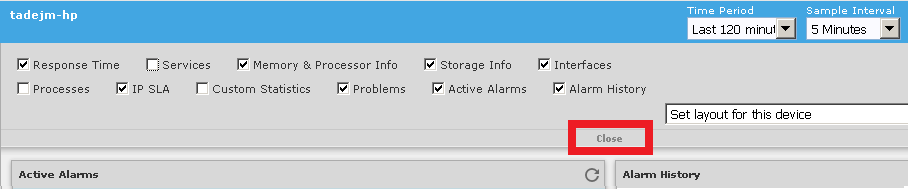
To close the Edit Page Layout drop-down frame, click the Close link at the bottom of the Edit Page Layout drop-down frame.
Figure : Closing the Edit page layout drop-down frame