Creating Custom Reports
Net Inspector lets you configure custom report pages, containing graphs and tables displaying metrics monitored on one or more devices. A custom report page can contain one or more frames and each frame can contain one report (graph, table, map, external HTTP page, etc.). Examples of reports are Top10 reports, a table of collected values (e.g., response time, disk usage, interface bitrate, etc.), a graph showing device CPU usage, etc.
You can also create a “network map” type of report that displays the contents of a (sub)map that exists in the Devices panel, Map View frame.
In addition, custom report pages can be added (docked) to quick link tabs that appear under the main header tabs in Net Inspector desktop. For more information about quick links, refer to the Configuring Quick Links section.
Furthermore, custom report pages can be converted to PDF format.
This section describes how to configure a custom report page with one custom report - a table showing the Top 5 devices by CPU load. It also describes how to add this custom report page to quick link tabs.
Custom report pages can contain more than one report (graph or table), as described in the next topic.
Click the Reports tab in the main window to display the Reports page.
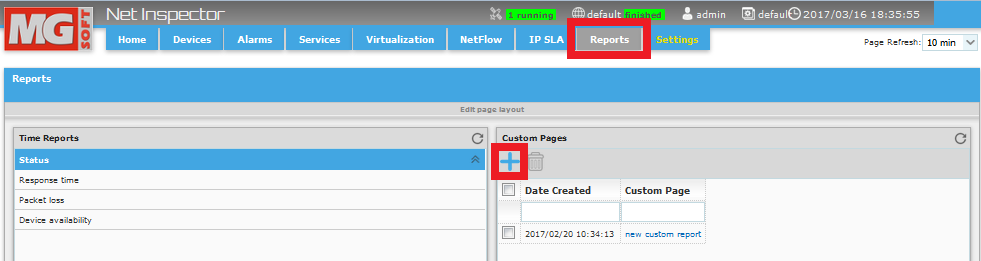
In the Custom Pages frame, click the Add New button (
 ), as shown
in the figure above to start configuring a new custom report
page.
), as shown
in the figure above to start configuring a new custom report
page.The Custom Report Page configuration page appears (Figure) with the Edit Page Layout drop-down frame open at the top of the page, and one custom report Properties frame where you can configure the first custom report on this page. Note that custom report pages can contain more than one report (graph or table).
Into the Custom page title input line in the Edit Page Layout drop-down frame at the top of the page, enter the title of the custom report page you are creating (see the figure below).
Figure: Setting the number of columns for a custom report page
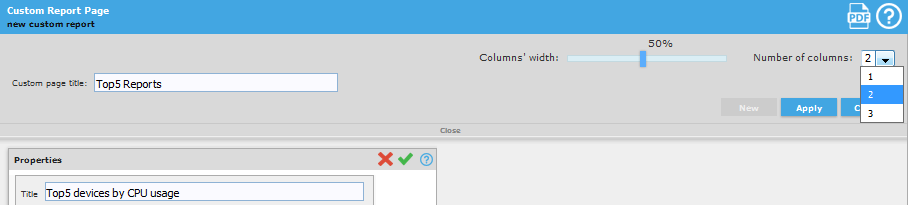
Select the desired number of columns for the custom report page from the Number of columns drop-down list in the Edit Page Layout drop-down frame (as shown in the figure above). A custom report page can contain 1, 2 or 3 columns of custom reports.
Use the Columns' width slider in the Edit Page Layout drop-down frame to set the width of the columns (reports) in the page (as % of the total page width) and click the Apply button to apply and view the change.
Figure: Example of setting a Top5 report properties in the custom page configurator
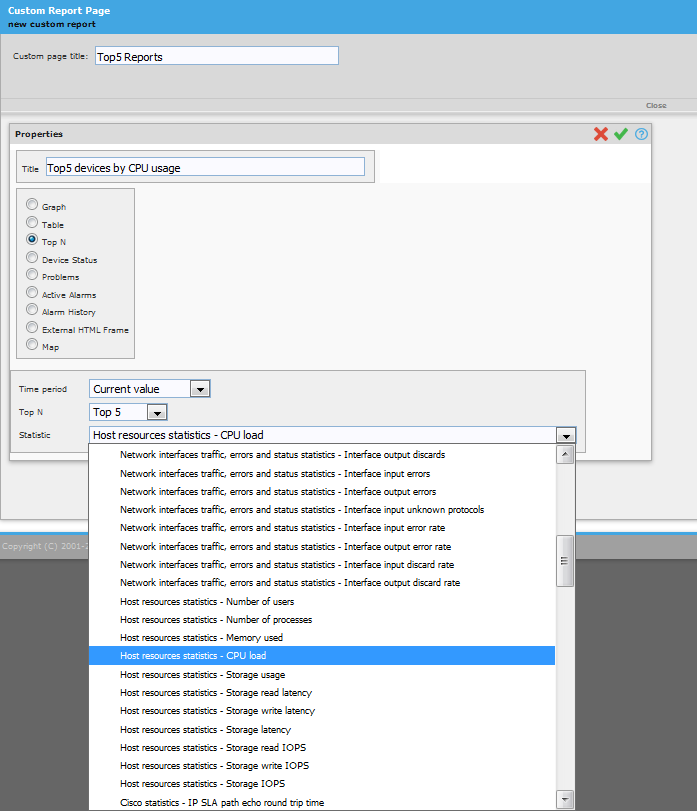
Title (input line)
Enter the title for the report you are creating (if left blank, automatic title will be created based on the options you select below).
Report type (radio button and associated property controls):
Graph – lets you create a report page containing a graph (bar chart) of one or more metrics (statistics) monitored on one or more devices.
Net Inspector can display a graph of all numeric metrics collected through polling, like the device response time, packet loss, availability, interface-related statistics, host resources-related statistics, Cisco-related statistics (including IP SLA), processes and services statistics, etc.
For these metrics, the desired time interval, granularity (sample interval), graph scale (linear, logarithmic), value category (average/sum, min., max), graph color(s), and the devices whose statistics will be plotted can be selected. For some metrics, additional properties can be selected (e.g., specific interfaces for interface-related metrics, specific services for service-related metrics, specific storage units for storage-related metrics, etc.).Table – lets you create a report page containing a table of values of one or more metrics monitored on one or more devices (e.g., CPU usage, interface utilization, device availability, etc.).
Here, all metrics collected through polling can be selected, like the device response time, packet loss, availability, interface-related statistics, host resources-related statistics, Cisco-related statistics (including IP SLA), processes and services statistics, custom (user-defined) statistics, etc.
For these metrics, the desired time interval, granularity (sample interval), and value category (average/sum, min., max), and the device whose statistics will be shown can be selected. If you set the Sample interval value to "Whole interval", you can add more than one metric to the table. For some metrics, additional properties can be selected (e.g., specific interfaces for interface-related metrics, specific services for service-related metrics, specific storage units for storage-related metrics, etc.).Top N – lets you create a report that displays a list of N instances (N=5, 10, 20, etc.) of the given metric (e.g., response time, CPU usage, interface utilization, etc.) with the highest (Top N) or lowest (Bottom N) value.
Device status – lets you create a report that displays a list of devices and their current statuses (and active alarms). A list can include either all devices or a subset of devices in the system.
Problems – lets you create a report that provides a summary of current and past problems on monitored devices. The report contains an (expandable) list of alarms that are open or have been open within the last 30 days time frame. By expanding an alarm entry in the list, one can view devices associated with the given alarm.
Active Alarms - lets you select a report that displays a list of active alarms on all devices. The list of active alarms can be filtered by using alarm filters (e.g., to show alarms only for a specific subset of devices in the system, etc.), as explained in the Managing Active Alarms topic.
Alarm History - lets you select a report that displays a history list of alarms on all devices within the selected time period (e., Last 120 minutes, etc.). Alarm History list can be filtered by using alarm filters (e.g., to show alarms only for a specific subset of devices in the system, etc.) as explained in the Using Filters topic.
External HTTP frame – lets you create a report page containing an existing HTTP page on any web site by specifying its URL and display size in pixels in the accompanying input lines.
Map – lets you create a network map report page that displays the contents of the selected submap (in Graphics view) that exists in the Devices page - Map View frame. One can select the root map of a user view or any of its submaps.
Depending on the type of the custom report you select, a different set of options is available from the accompanying drop-down lists (e.g., Time period, Statistics, Sample Interval, Value, etc.). Select the desired options from available drop-down lists (in our example, we selected the Time period=Current value, TopN=Top 5, and Statistics=Host resources statistics - CPU load options).
Click the OK button (
 ) in the
titlebar of the report Properties frame to create
and view the new report
page containing one object (=table of 5 devices with currently
highest CPU usage). Note that custom report pages are dynamic
in nature, meaning that their content is automatically updated
(when the page is refreshed) to reflect the current state
(i.e., in our example we selected to show the current value
in the Top5 report in order to always display those 5 devices
that have the highest CPU load at that time).
) in the
titlebar of the report Properties frame to create
and view the new report
page containing one object (=table of 5 devices with currently
highest CPU usage). Note that custom report pages are dynamic
in nature, meaning that their content is automatically updated
(when the page is refreshed) to reflect the current state
(i.e., in our example we selected to show the current value
in the Top5 report in order to always display those 5 devices
that have the highest CPU load at that time).Figure: Viewing custom report page containing one report (table)
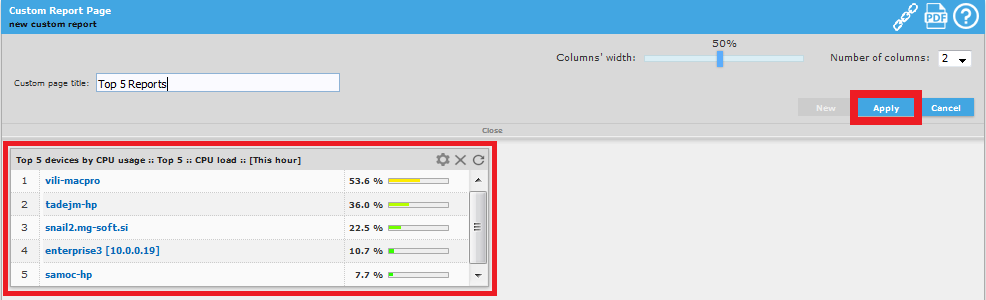
Click the Apply button in the Edit Page Layout drop-down frame at the top of the page (see the image above) to apply and save the changes.
Optionally, click the New button in the Edit Page Layout drop-down frame to add another report (frame) to the custom report page.
When finished, click the Close button in the Edit Page Layout drop-down frame to close it.
The custom report page is now created and available for viewing to all users with the same privileges.
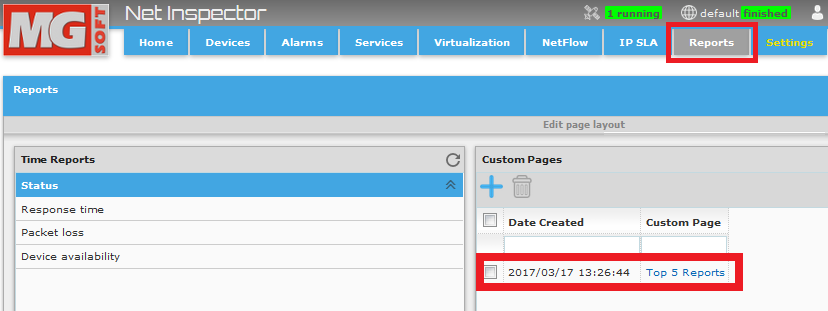
Click the Reports tab in the main window to display the Reports page again, where the new report page is listed in the Custom Pages frame (as shown in the figure below).
Figure: Reports page with one (newly configured) custom report page
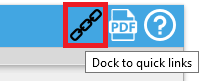
Tip: To make the custom report page easily accessible, you can add it to the quick link tabs (displayed under the main header tabs) by clicking the Dock to quick links button in the right section of the titlebar (see the image below). For more information about quick links, refer to the Configuring Quick Links section.
Figure: Adding a custom report page to quick links