About Net Inspector Desktop
MG-SOFT Net Inspector web-based desktop contains a header section at the top and the page section below the header section, as shown in the image below.
Figure: Net Inspector desktop explained
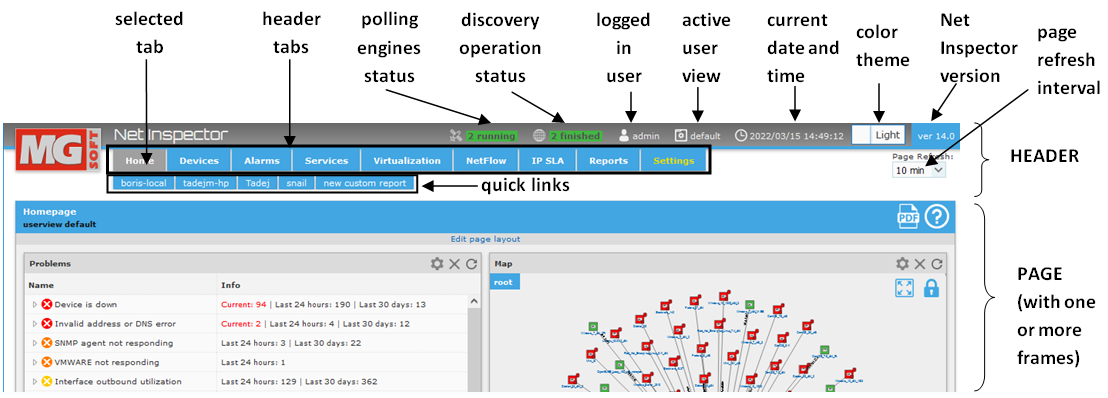
The header section contains tabs for switching between different pages (e.g., Home, Devices, Alarms, etc.), optional quick link tabs with links to custom reports and device pages, and several sections that provide information about the currently logged on user, currently active user view, current date and time, polling engine status, discovery operation status, page refresh interval and Net Inspector version. Click any of these sections to open the respective drop-down list with additional information.
Net Inspector user interface features also the Light and Dark color themes, as explained in the Selecting Color Theme topic.
The following header tabs and corresponding pages are available:
Home
The Home page is displayed automatically when a user logs in to Net Inspector. Home page contains the default dashboards (reports) for the currently active user view. Home page can be customized to include custom reports (graphs, tables), external web pages (included as HTTP frames), and network maps containing devices. Home page falls into category of custom report pages and is configured in the same manner.
Devices
The Devices page lets you monitor and configure devices in the currently active user view. The Devices page contains the Map View frame, in which administrators can configure a hierarchical structure of maps and add devices and graphic elements (lines, connections, rectangles, bitmaps, etc.) and text to maps to model the monitored network. On maps, one can monitor the current status of devices, and the basic device alarm information (the number of open and new alarms and severity of the most critical alarm associated with the device). Devices can be viewed in form of a network map (graphics view) or a list (details view). By default, Devices page contains also the list of active alarms.
Alarms
The Alarms page displays all active (open) alarms associated with the devices and the history of alarms.
Services
The Services page displays a list all monitored services on devices by service category (DNS, HTTP, IMAP, SSH,…) and a list of services with status “Critical”. By clicking a service on the list, more detailed statistics for the selected service is displayed (service availability and round trip time (RTT)).
Virtualization
The Virtualization page lets you monitor the health and performance of the virtualization infrastructure. It contains a list of monitored virtualization (hypervisor) servers, their current status and alarms, a list of all virtual Machines (VMs) on these servers and their status and alarms. It provides and overview of virtual resources usage (datastores, CPU, memory, network) and displays a list of problems related to the virtualization infrastructure.
NetFlow
The NetFlow page displays the list of all configured NetFlow and sFlow source devices (if any) and the TopN NetFlow traffic reports for all NetFlow sources. By expanding and clicking the individual subentries in the Top N reports, more detailed statistics for the selected item (e.g., device, interface, conversation, application, etc.) is shown.
IP SLA
The IP SLA page displays a lists of the IP SLA operations monitored on your (Cisco) devices and related statistics (e.g., round trip times, jitter, packet loss, etc.).
Reports
The Reports page contains a series of predefined fault and performance management reports (e.g., device availability, number of alarms per severity, network interface utilization,…). In addition, the Report page lets you configure also custom reports, containing graphs or tables displaying metrics monitored on one or more devices. Examples of such custom reports are Top10 reports, reports of monitored objects with problems, etc.
Settings
The Settings page is used for configuring Net Inspector settings. This includes managing Net Inspector users, user views, polling profiles, access profiles, alarm notifications (e-mail. command), device types, alarm types, trap-to-alarm rules, auto-configuration settings, etc. The majority of settings in this page is accessible only to administrators.