Monitoring Network Services
Net Inspector supports monitoring the following TCP and UDP network services: HTTP, HTTPS, FTP, DNS, SMTP, IMAP, IMAPS, POP3, SSH, Telnet, NNTP, NNTPS, SIP, H.323, LDAP, LDAPS, IPP, LPD, MsSQL, MySQL and Oracle service.
Monitoring of network services is enabled by default, meaning that devices are automatically scanned for supported network services and detected services are automatically monitored by Net Inspector. You can customize which of the supported network services will be monitored on which device in the Edit Device Monitoring Options dialog box – Services tab, as described in the Configuring Device Monitoring Options (General, Interfaces, Storage Units, Processes, Services) section.
Monitoring of network services can be disabled altogether in the polling profile that is assigned to the given device.
Click on the Services tab in Net Inspector header to display the Services page (shown in the figure below).
Figure: The Services page
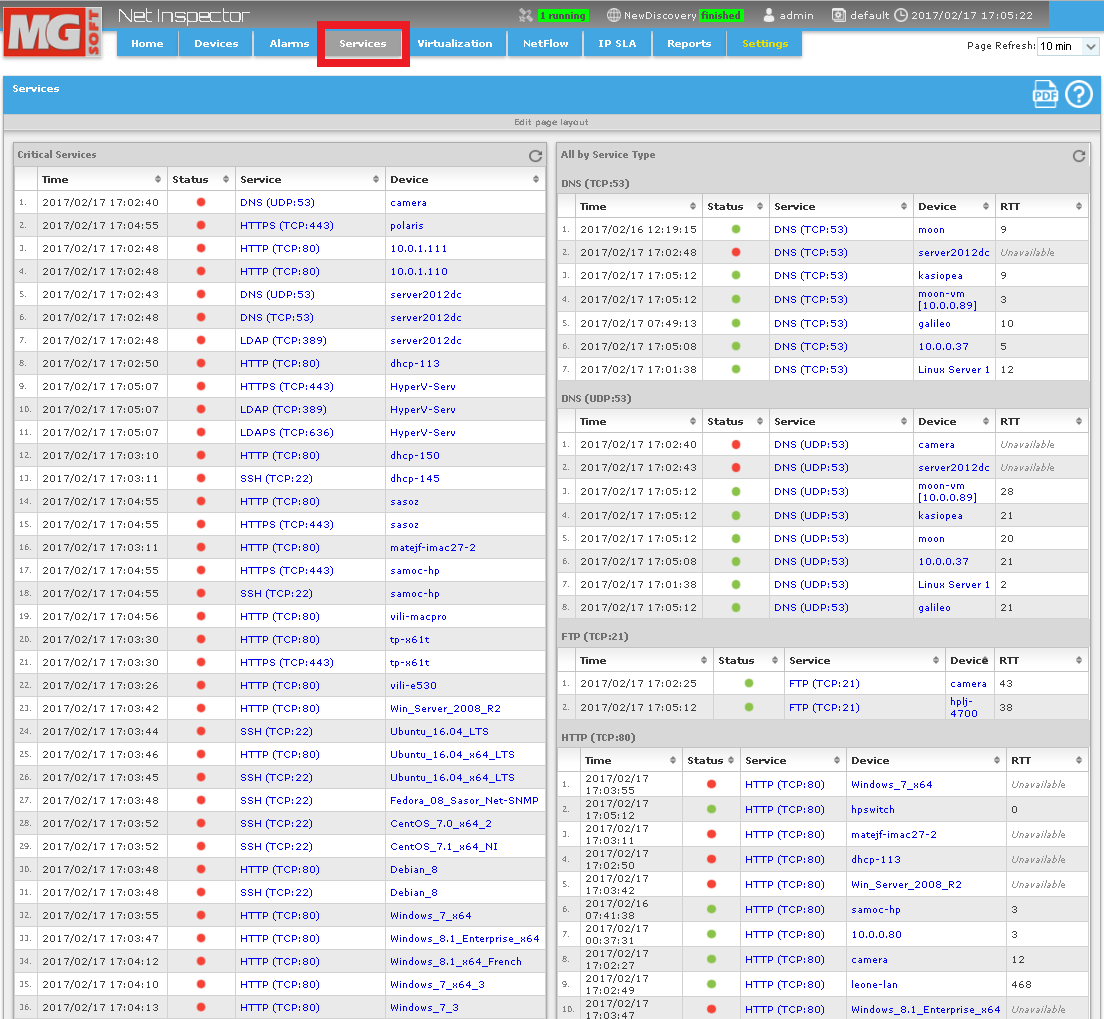
The Services page displays a table of all monitored services by type (DNS, HTTP, IMAP, SSH,…), which displays the current status and round trip time (RTT) value of each (responding) service. In addition, a table of services with the status of “Critical” is shown. Critical status means that the service is currently not available (not responding to Net Inspector queries).
To sort services by any column, click the respective column header (e.g., Device, Status, RTT, etc) in the given table.
Click a service in the list, to view more detailed statistics (service availability [in %] and RTT [in ms] history graphs) for the given service.
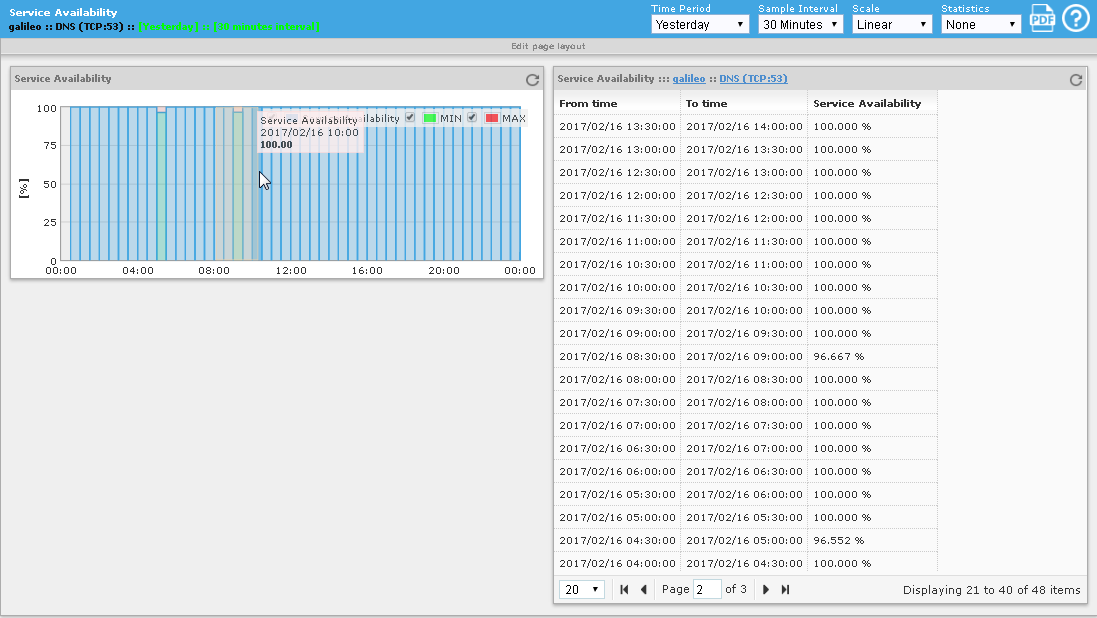
Figure: Viewing the availability history of a HTTP (www) service

Click the graph to view more detailed service availability information (graph and table showing the service availability statistics).
Figure: Viewing the availability history of a HTTP service and zooming-in the graph
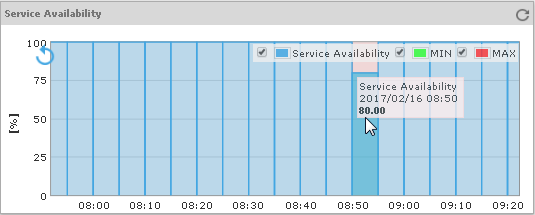
To zoom into a specific portion of a graph, select the desired portion of a graph with mouse (see image above).
Figure: Viewing a zoomed-in portion of a service availability graph
To zoom out the graph, click the Back button in the graph (
 ) or the Refresh button in the graph titlebar
(
) or the Refresh button in the graph titlebar
( )
.
)
.