Net Inspector can monitor the organization's virtualization infrastructure, i.e., virtualization servers (VMware ESX/ESXi and vCenter and Microsoft Hyper-V), the associated guest virtual machines (VMs) and the resource usage of virtualization servers and VMs, like the CPU and memory usage, network utilization and traffic and the server datastore usage. The information about virtualization infrastructure is displayed on the Virtualization page described in this topic.
For instructions on how to add a virtualization server and its virtual machines as monitored devices to Net Inspector, please refer to the Adding Virtualization Servers and VMs topic.
Note: For a virtualization server device to appear in the Virtualization page, it must be polled via WMI (applies to Microsoft virtualization servers) or via VMware web service (applies to VMware vSphere virtualization servers).
This topic describes how to
monitor the virtualization infrastructure in Net Inspector.
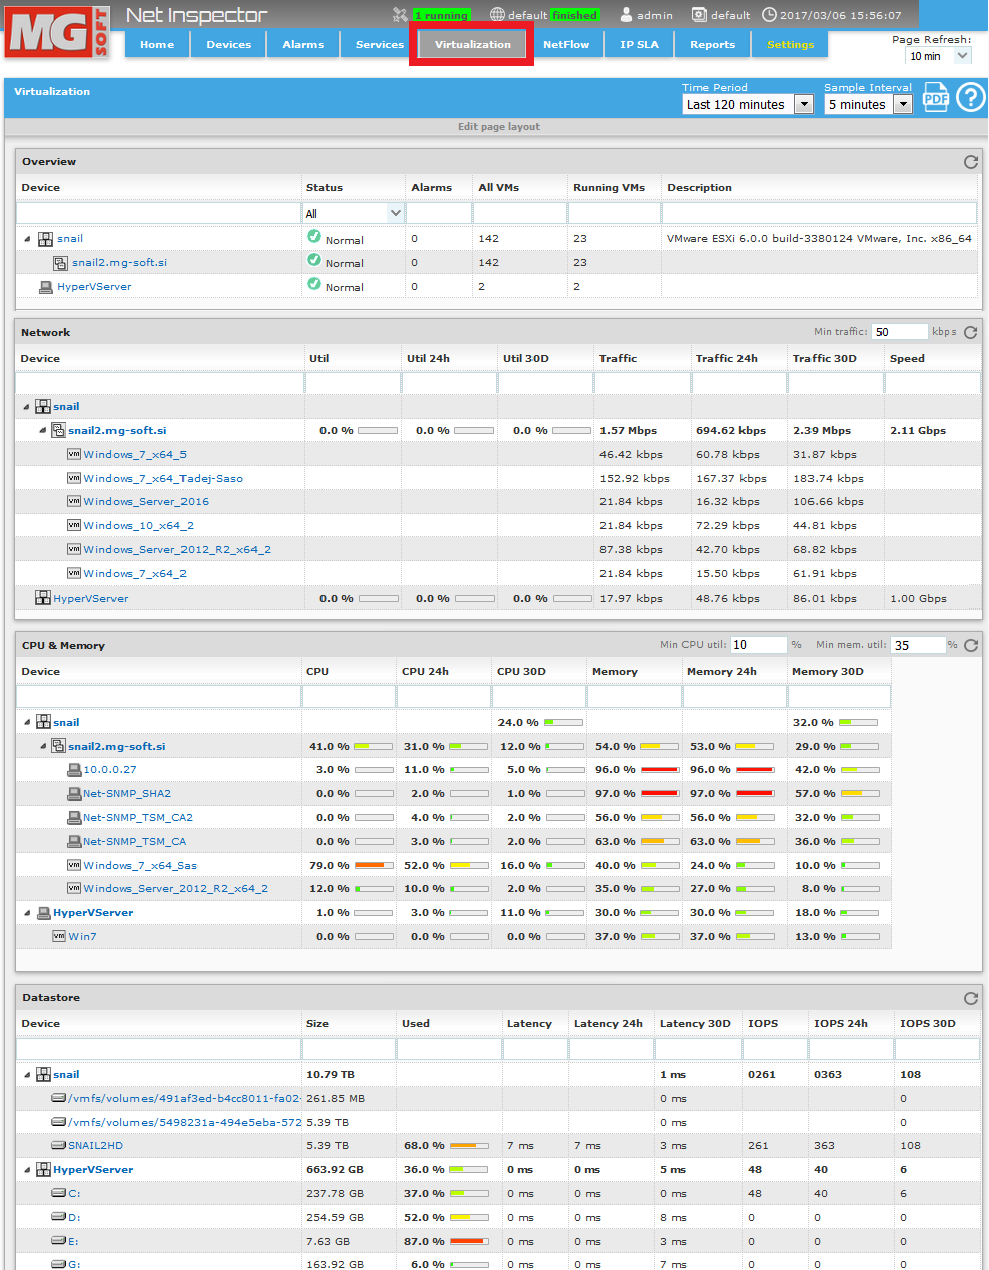
Click the Virtualization tab in Net Inspector header to display the Virtualization page (shown in the figure below).
Figure: The Virtualization page (single column display)
The Virtualization page displays information about monitored virtualization servers, their guest virtual machines (VMs) and the resource usage of virtualization servers and VMs in several frames, as described below.
The Overview frame displays a list of monitored virtualization servers (VMware ESX/ESXi and vCenter and Microsoft Hyper-V). Typically, these are devices of type virtual server and virtual host in Net Inspector. In case of VMware virtualization, a two level virtualization server hierarchy is used, with the top level being the virtual server and the lower level being the virtual host(s). In this case, the virtual server represents the control plane of the virtualization infrastructure, which is either a vCenter server or a control plane of the ESXi hypervisor. The virtual host represents the host machine that runs the virtual machines. In case of Microsoft Hyper-V virtualization, only one level is present, i.e., a virtual server.
The Overview frame displays the current status of virtual servers and hosts, the number of all virtual machines (VMs) per server/host and the number of running VMs per server/host.
You can sort the list by any column by clicking the respective column header.
To quickly find the entries of interest in any column, enter the desired phrase in the quick filter field at the top of the respective column(s).
Click a device name hyperlink in the Overview frame to open the device performance page of that device (virtualization server).
The Network frame displays a list of monitored virtualization servers and their virtual machines (VMs) that exhibited certain (user-configurable) network utilization and traffic in the past 30 days. The term traffic means throughput in kilobits per second summed for all network interfaces on the machine. The term utilization means network utilization in percent and is calculated by dividing traffic with the nominal speed of the interfaces on the machine (if the speed value is provided by the virtualization server).
A separate value (column) is shown for the current traffic, average traffic in the last 24 hours, and average traffic in the last 30 days. If the nominal speed of device's interfaces is known (shown in the Speed column), then the interface utilization values and bar charts are also shown for the given device (current, 24hours, and 30days utilization).
By default, this frame
displays those VMs, whose traffic exceeds 10kbps
(in any category: current, 24h or 30d). To change this threshold,
specify the desired value in the Min.
traffic input line in the frame titlebar and press the Refresh button
( )
to apply the change.
)
to apply the change.
You can sort the list by any column by clicking the respective column header.
To quickly find the entries of interest in any column, enter the desired phrase in the quick filter field at the top of the respective column(s).
Click a device name hyperlink in the list to open the device performance page of that device (virtualization server or VM).
The CPU and Memory frame displays a list of monitored virtualization servers and their virtual machines (VMs) that exhibited certain (user-configurable) CPU and memory usage in the past 30 days. A separate value and horizontal bar chart is shown for the current CPU usage, average CPU usage in the last 24 hours and the average CPU usage in the last 30 days. The same values are shown for the memory usage (current, 24hours, 30days).
By
default, this frame displays those VMs, whose CPU usage exceeds 10% (in any category: current,
24h or 30d) and whose memory usage exceeds 35%
(in any category). To change these thresholds, specify the desired
values in the Min.
CPU util. and
MIn. mem.
util. input lines in the frame titlebar and press the Refresh button
()
to apply the change.
You can sort the list by any column by clicking the respective column header.
To quickly find the entries of interest in any column, enter the desired phrase in the quick filter field at the top of the respective column(s).
Click a device name hyperlink in the list to open the device performance page of that device (virtualization server or VM).
The Datastore frame displays a list of datastores (storage volumes) used by the monitored virtualization servers, and their sizes, usage, latency and IOPS (if this information si provided by the virtualization server). For the latency and IOPS (Input/Output Operations per Second), the current value, 24-hours average and 30-days average is displayed (if available).
You can sort the list by any column by clicking the respective column header.
To quickly find the entries of interest in any column, enter the desired phrase in the quick filter field at the top of the respective column(s).
Click a device name hyperlink in the list to open the device performance page of that device (virtualization server).
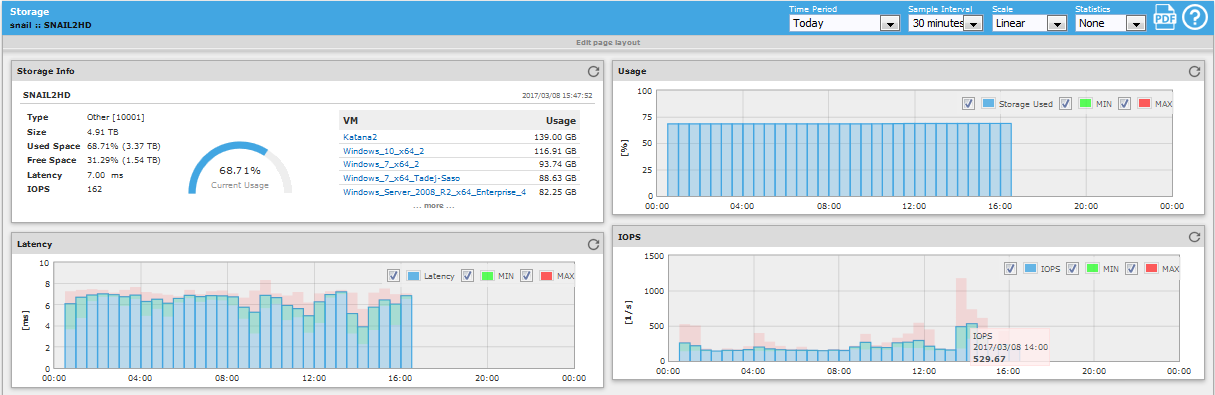
Click a datastore name hyperlink in the list to open the storage performance page of the given storage volume and view history graphs for it and optionally drill-down to a more detailed reports with history data (in form of a graph and table) for a desired metric (e.g., IOPS). An example of a storage performance page is shown in the image below.
Figure: Viewing history graphs for a storage volume used by a virtualization server
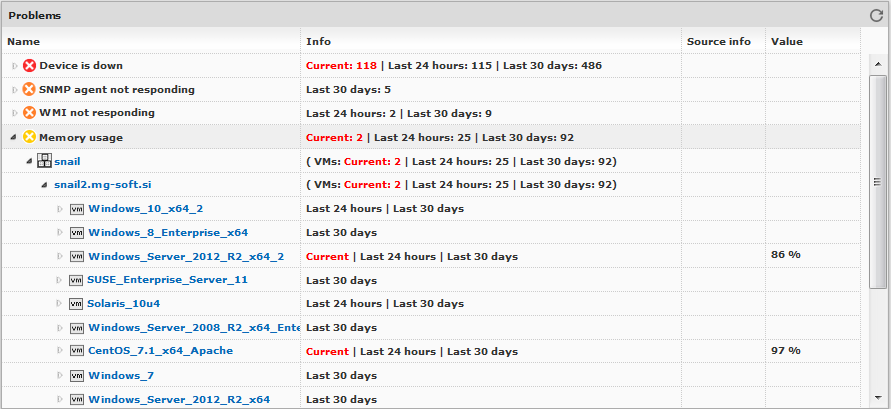
The Problems frame provides a summary of current and past problems on the virtualization infrastructure. This frame displays all types of alarms related to the monitored virtualization servers and VMs (e.g., Device is down, SNMP agent not responding, HTTP service failed, etc.) that are open or have been open within the last 30 days time frame.
For each alarm type the number of currently active alarms is shown (if any), the number of alarms that existed within the last 24 hours (if any), and the number of alarms that existed within the last 30 days (if any) - without the last 24 hours. The last two values do not include current alarms.
By default, alarm types are ordered by severity, with the most severe (critical) alarms on top.
Click
the expand symbol ( ) in front of
an alarm to view more information about the virtualization
servers or their VMs that exhibited the given alarm type (as shown
in the image below).
) in front of
an alarm to view more information about the virtualization
servers or their VMs that exhibited the given alarm type (as shown
in the image below).
For servers and VMs on which the expanded alarm type is still open, the red Current notice is shown in the Info column and the Value column displays the current value of the corresponding parameter if applicable (e.g., memory usage in %). The Source Info column shows additional information about the source of alarm for certain alarm types (e.g., Interface is down, etc.).
The Info column will show also the Last 24 hours and Last 30 days indication for a VM if the given alarm existed on that VM in last 24 hours or Last 30 days, respectively. No value is shown for these items (value is shown only for the current alarms).
Click a device name hyperlink in the list to open the device performance page of that device (virtualization server or VM).
Figure: Viewing details for high memory usage alarms on virtualization servers and VMs