Net Inspector Home Page
After a successful login, the Net Inspector home page is displayed in your web browser application.
Figure: Net Inspector home page (default layout)
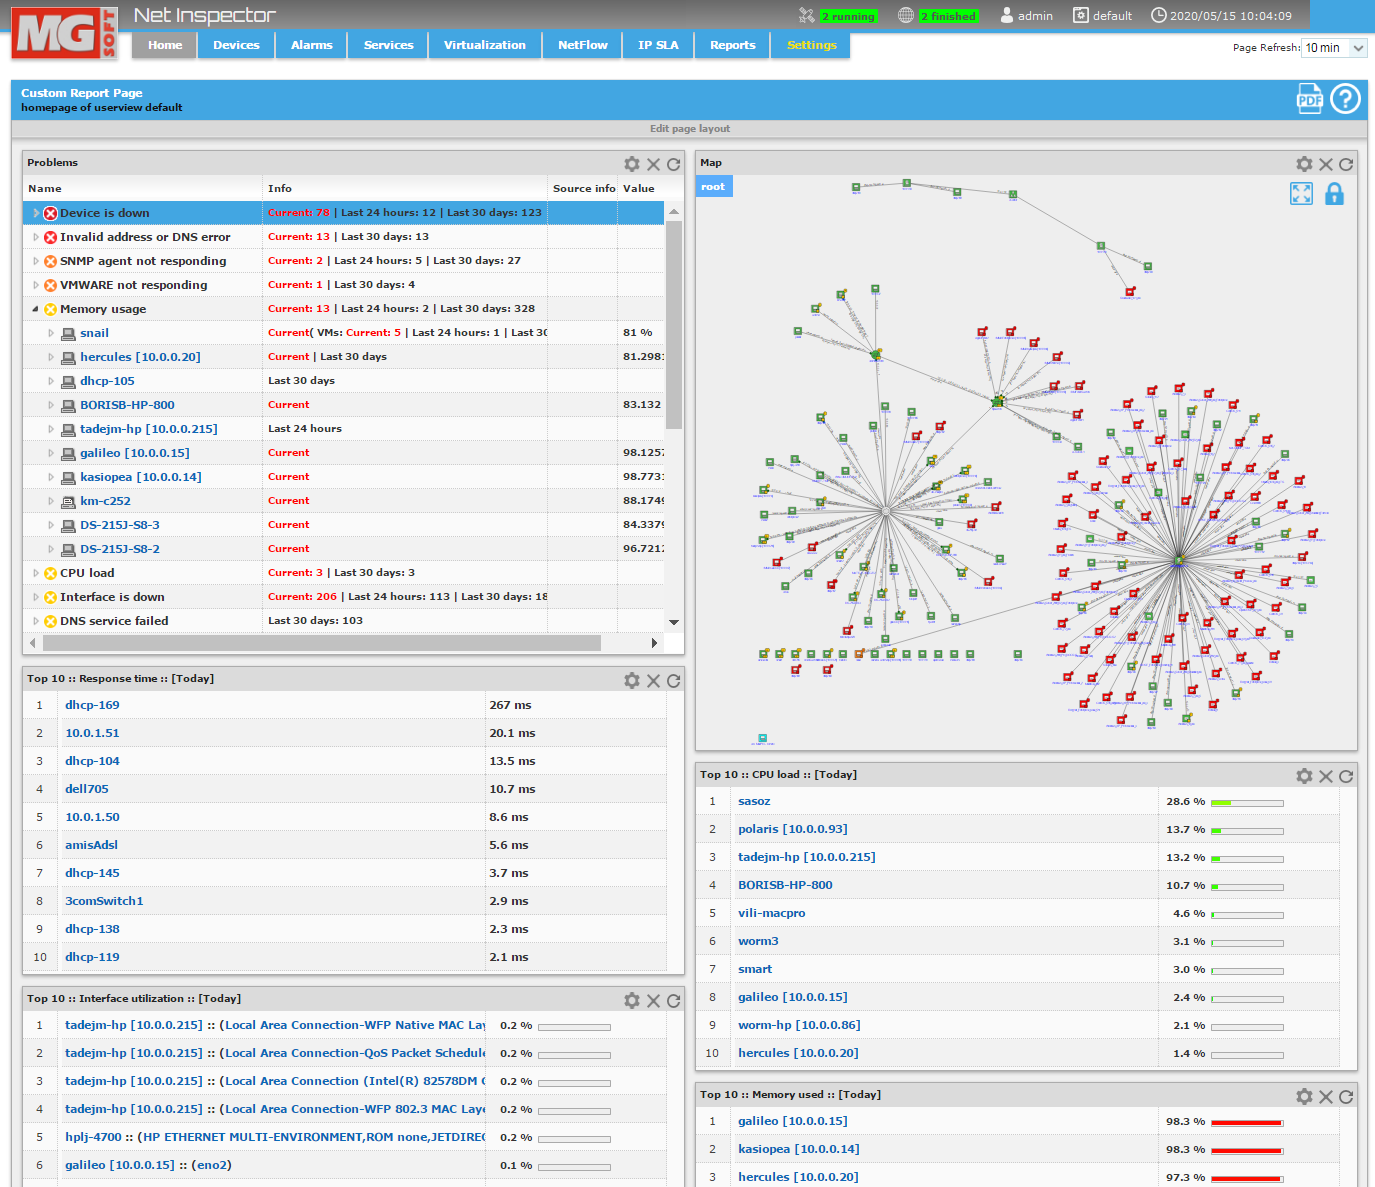
By default, Net Inspector home page contains the following dashboards (reports):
Problems
The Problems frame provides a summary of current and past problems (alarms) on all devices in current user view. This frame displays all types of alarms (e.g., Device is down, SNMP agent not responding, HTTP service failed, etc.) that are open or have been open within the last 30 days time frame.
For each alarm type the number of currently active alarms is shown (if any), the number of alarms that existed within the last 24 hours (if any), and the number of alarms that existed within the last 30 days (if any) - without the last 24 hours. The last two values do not include current alarms.
By default, alarm types are ordered by severity, with the most severe (critical) alarms on top.
Click the expand symbol () in front of an alarm to view more information about the devices that exhibited the given alarm type.
For devices on which the expanded alarm type is still open, the red Current notice is shown in the Info column and the Value column displays the current value of the corresponding parameter if applicable (e.g., memory usage in %). The Source Info column shows additional information about the source of alarm for certain alarm types (e.g., Interface is down, etc.).
The Info column will show also the Last 24 hours and Last 30 days indication for a device if the given alarm existed on that device in last 24 hours or Last 30 days, respectively. No value is shown for these items (value is shown only for the current alarms).
Click a device name hyperlink in the list to open the device performance page of that device.
Network Map
The Network Map frame displays the contents of a map (devices, submaps, graphic objects) in the same manner as the Map View frame - Graphics view. By default, this frame displays the contents of the root map of the active user view, however, one can configure this frame to display the contents of any (sub)map in the current user view. For more information about the map view and information provided by icons on maps, please refer to the Map View frame - Graphics view topic.
By
default the map contents is locked. Click the Lock
toggle button ( ) to unlock the map. When unlocked
(
) to unlock the map. When unlocked
( ), you can:
Use your mouse wheel to zoom-in or zoom-out the map view. Click the Fit to screen button (
 ) n the upper-right
corner to automatically adjust the zoom level to display all
devices on the map.
) n the upper-right
corner to automatically adjust the zoom level to display all
devices on the map.To pan the view, right-click the map, hold down the right mouse button and drag the map in direction you wish to pan.
To
configure which submap will be displayed in the Network map frame,
click the Configure
button ( ) in the upper right section of the frame
titlebar. The Properties dialog box appears that lets you select the
(sub)map to be displayed and set the map width and height in pixels.
When finished, click the OK
button (
) in the upper right section of the frame
titlebar. The Properties dialog box appears that lets you select the
(sub)map to be displayed and set the map width and height in pixels.
When finished, click the OK
button ( ) in the frame titlebar to apply
and view the changes.
) in the frame titlebar to apply
and view the changes.
Top 10: Response time: today
This report displays up to 10 devices in the current user view with the highest average response time in the given day. This is one of the TopN reports available in Net Inspector. For more information on available reports, consult the Creating Custom Reports topic.
Click a device name hyperlink in the list to open the device performance page of that device..
To configure this report (e.g., set a different Time period, TopN, Statistics, etc.), click the Configure button (
) in the upper right section
of the frame titlebar and select the desired values form the
Properties dialog box that appears. When finished, click the
OK button
() in the frame titlebar to apply and
view the changes.
Top 10: CPU load: today
This report displays up to 10 devices in the current user view with the highest average CPU load in the given day.
Top 10: Interface utilization: today
This report displays up to 10 devices (and their interfaces) in the current user view with the highest average interface utilization in the given day.
Top 10: Interface traffic: today
This report displays up to 10 devices (and their interfaces) in the current user view with the highest average interface traffic in the given day.
Top 10: Memory usage: today
This report displays up to 10 devices in the current user view with the highest average memory usage in the given day.
Top 10: Storage usage: today
This report displays up to 10 devices in the current user view with the highest average storage usage in the given day.
Top 10: Storage latency: today
This report displays up to 10 devices in the current user view with the highest average storage latency in the given day.
Top 10: Storage IOPS: today
This report displays up to 10 devices in the current user view with the highest average storage IOPS (Input-Output Operations per Second) in the given day.
The home page can be configured in the same manner as custom report pages in Net Inspector. Note that each user view has its own home page. You can configure the home page, for example, to include different or additional information. To start customizing the home page, click the Edit page layout link below the title bar of the user home page frame. Follow the guidelines in the Editing Custom Report Pages topic.
See Also: