The Services frame displays the status of monitored network services (e.g., HTTP, FTP, DNS, SMTP, etc.) on the device. To be able to monitor the status of services, the services monitoring must be enabled in the polling profile that is assigned to the given device.
One can configure which of the supported standard services will be monitored in the Edit Device page, Services tab.
The following icons are used to indicate the current status of services:
![]() -
Service is available
-
Service is available
![]() -
Service is not available
-
Service is not available
Figure: Services frame in the device performance page
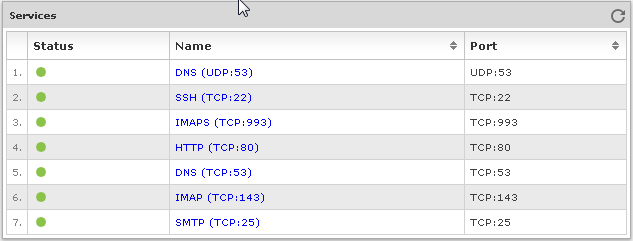
By clicking a service in the list, you can view its availability graph and table in a dedicated web page.
Figure: Viewing history graphs for a specific service
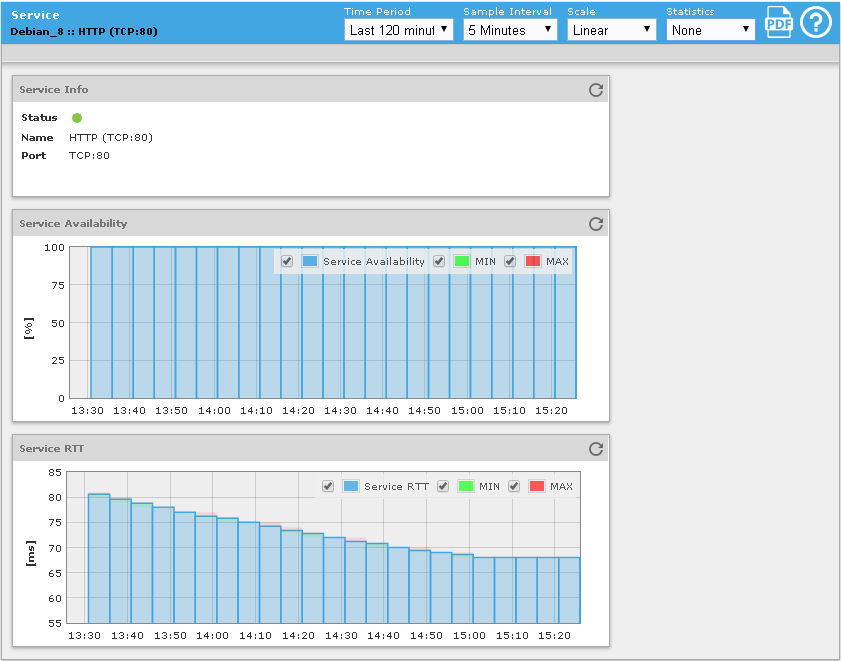
Click on a graph to drill-down to a web page with history data (in form of a graph and table) for the corresponding metric (e.g., Service Availability).