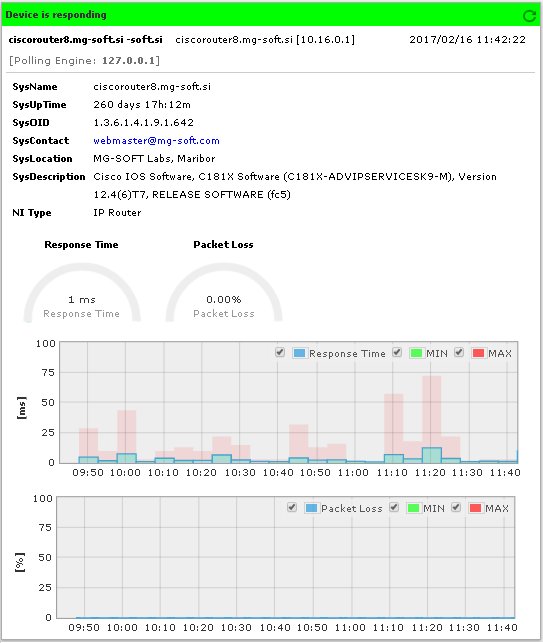
The Device Info & Response Time frame in the device performance page displays the basic information about the given device, its status (titlebar color and text) and ICMP ping statistics (if available).
The upper section displays the general information about the device, like its hostname/IP address configured in Net Inspector and the basic system information retrieved from the device (e.g., System Name, System Up Time, System Location, System Description, etc.).
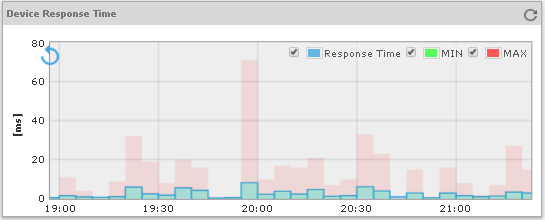
The lower section displays the ICMP ping statistics history graphs, i.e., device response time (in milliseconds), and the packet loss rate (in %). The current response time and packet loss rate are presented also in gauge charts.
Figure: Device Info & Response Time frame in the device performance page
Click on a graph to view history data (in form of a graph and table) for the given metric (e.g., Response Time), as shown in the figure below.
Figure: Viewing a history graph for device response time
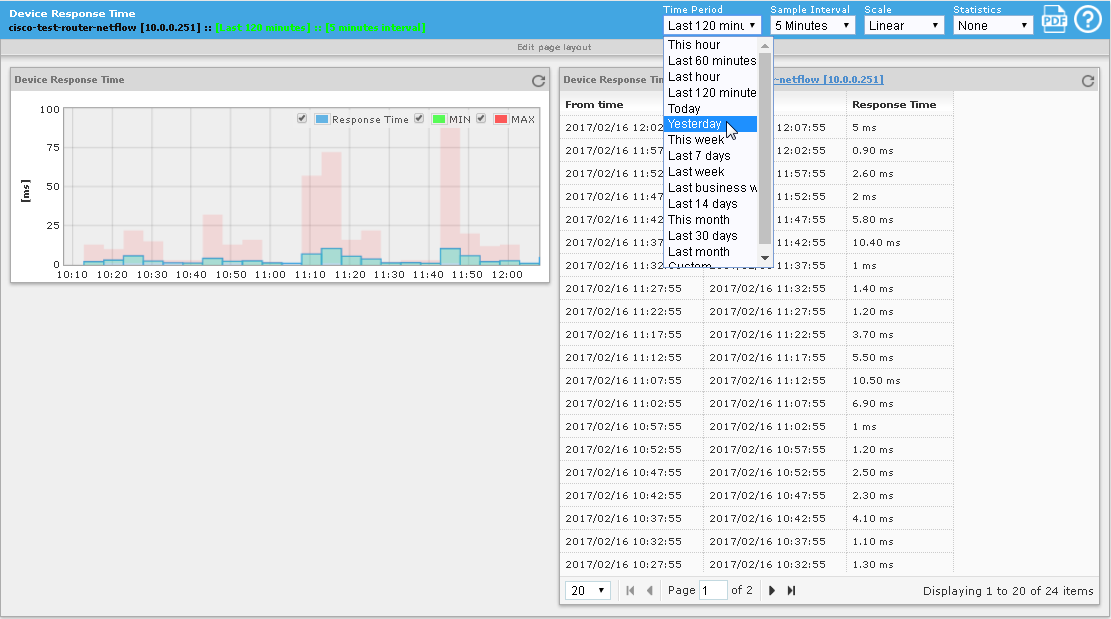
To view graph for a different time frame or with a different sample interval, select desired entries from the Time Period or Sample Interval drop-down lists in the upper-right section of the titlebar (see the image above). Optionally, set a different scale (e.g., logarithmic) or enable displaying a trend line or a 95-percentile line (or both) on the graphs by selecting the relevant options from the Scale and Statistics drop-down menus, respectively.
Hover your mouse cursor over any bar in a graph, to display the metric value and time in a tooltip.
To zoom into a specific portion of a graph, select the desired portion of a graph with mouse.
To zoom out the graph,
click the Back button in the
graph (![]() ) or the Refresh
button in the graph titlebar (
) or the Refresh
button in the graph titlebar ( ).
).
Figure: Viewing a zoomed-in portion of a graph