This topic describes how to add graphic objects (e.g., rectangles, ellipses, lines, bitmap images, etc.), cloud symbols and text to maps. It also describes how to arrange devices, clouds, and graphic objects on a map.
Note: Only users with administrator access rights are permitted to add graphic objects to Net Inspector.
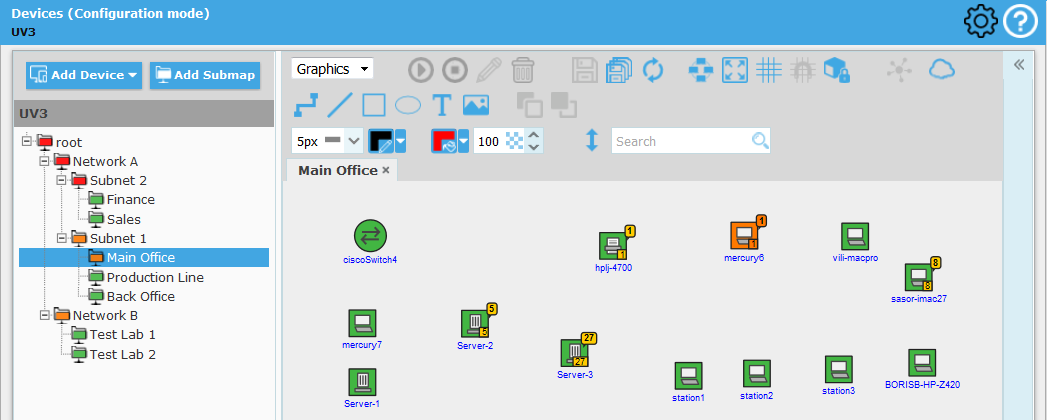
Click the Devices tab in Net Inspector header to display the Devices page.
In the upper-right section of the Devices frame, click the Configure button (as shown in the figure below) to enter the Configuration Mode.
Figure: Switching into map Configuration Mode
![]()
In the Explorer section of the Map View frame, select the map (e.g., the root map or any other map), which you would like to add graphic objects or text to.
Figure: Selecting a map to add graphic objects to (in Map View Configuration Mode)
A new tab appears in the middle section of the Map View frame, displaying the contents of the (sub)map selected in the left section (as shown in the figure above).
Use
your mouse wheel to zoom-in or zoom-out the map view. Click the Fit to screen
button ( )
to automatically adjust the zoom level to display all devices on the
map.
)
to automatically adjust the zoom level to display all devices on the
map.
To pan the view, right-click the map, hold down the right mouse button and drag the map in direction you wish to pan.
To quickly find a device on the map, enter its name (or part of it) into the Search input line in the toolbar and press Enter. Net Inspector will select the matching devices and zoom into the portion of the map, as shown in the figure below.
To add various graphic objects, images and text to a map, use the Graphics toolbar at the top of the middle section of the Map View frame, as follows:
To add a bitmap
image (e.g., .png, .jpg, .gif) to the map, select the Insert
image button ( )
in the Graphics toolbar and
click the image destination location on the map in the central section
of the Map View frame.
)
in the Graphics toolbar and
click the image destination location on the map in the central section
of the Map View frame.
The Image Manager dialog box appears that lists all images on Net Inspector Server and lets you select an image from the local computer to upload it to the Server and add it to the map.
Figure: The Image Manger dialog box lets you select an image to be added to a map
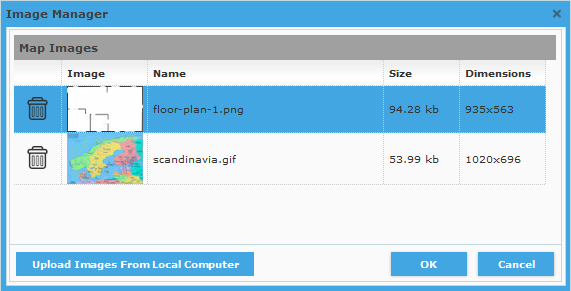
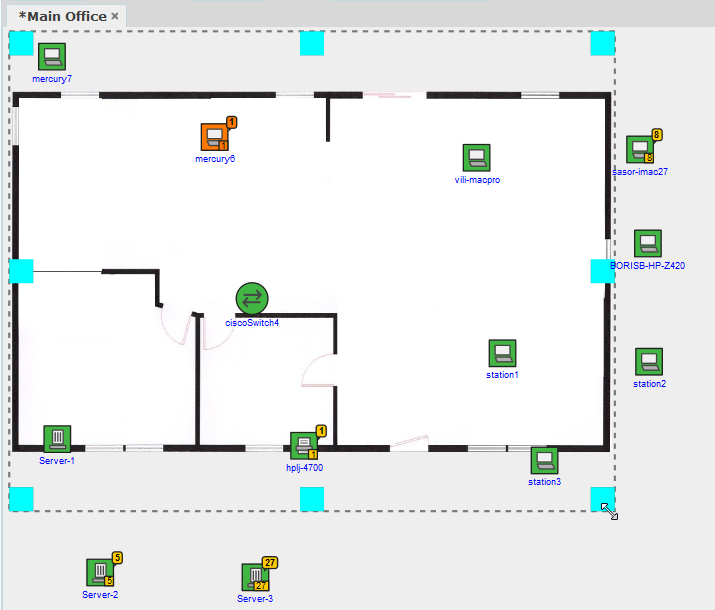
Choose an image from the Map Images list and click the OK button to add it to the map (as shown in the figure below). Alternatively, click the Upload Images From Local Computer button and select an image file from local computer. The image will be uploaded to Net Inspector Server computer and added to the Image Manager dialog box. Select the image Map Images list and click the OK button to add it to the map (as shown in the figure below).
Note: Images are always added to the background of a map, i.e., behind the device icons.
Figure: Selected image is added to the map background
If the
inserted image does not perfectly fit the size of the map, you can
enlarge or scale down the image by dragging an image resize handle
( ) in
the desired direction (as shown in the figure above).
) in
the desired direction (as shown in the figure above).
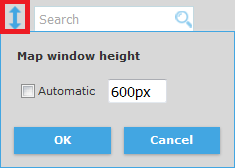
To change
the height or width of a map
in the Map View window, resize the Web browser window and reload
the page in the browser. To set the height of the map to a fixed value,
click
the Set
window height button ( ) in the Graphics
toolbar, uncheck the Automatic
checkbox in the dialog box that appears and enter the desired height
in pixels (see the image below). When the Automatic
option is enabled, the map height scales automatically with the height
of the Web browser window.
) in the Graphics
toolbar, uncheck the Automatic
checkbox in the dialog box that appears and enter the desired height
in pixels (see the image below). When the Automatic
option is enabled, the map height scales automatically with the height
of the Web browser window.
Figure: Setting the map height
To
add a rectangle object to a map, select
the Insert Rectangle button ( )
in the Graphics
toolbar,
then click on the map and hold down the mouse button while dragging
the mouse pointer across the map. Release the mouse button when the
size of the rectangle matches your preferences (see the image below).
)
in the Graphics
toolbar,
then click on the map and hold down the mouse button while dragging
the mouse pointer across the map. Release the mouse button when the
size of the rectangle matches your preferences (see the image below).
Figure: Adding a rectangle object to a map
To add an ellipse object to a map, select
the Insert Ellipse button ( )
in the Graphics
toolbar,
then click on the map and hold down the mouse button while dragging
the mouse pointer across the map. Release the mouse button when the
size of the ellipse matches your preferences.
)
in the Graphics
toolbar,
then click on the map and hold down the mouse button while dragging
the mouse pointer across the map. Release the mouse button when the
size of the ellipse matches your preferences.
To
add a line object
to a map, select the Insert Line button
( )
in the Graphics
toolbar,
then click on the map and hold down the mouse button while dragging
the mouse pointer across the map. Release the mouse button when the
length of the line matches your preferences.
)
in the Graphics
toolbar,
then click on the map and hold down the mouse button while dragging
the mouse pointer across the map. Release the mouse button when the
length of the line matches your preferences.
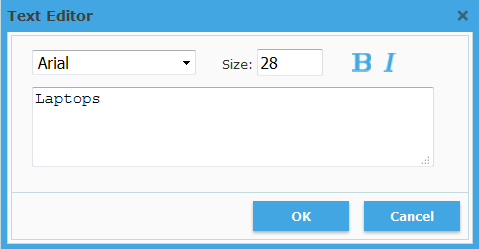
To
add text to a map,
select the Insert Text button
( )
in the Graphics
toolbar,
then click on the map where you wish the text to begin. This
opens the Text Editor dialog
box (shown below). Enter the text into the Text Editor dialog box,
adjust the font type and size to meet your preferences, and click
the OK button to close the dialog and display the entered
text on the map.
)
in the Graphics
toolbar,
then click on the map where you wish the text to begin. This
opens the Text Editor dialog
box (shown below). Enter the text into the Text Editor dialog box,
adjust the font type and size to meet your preferences, and click
the OK button to close the dialog and display the entered
text on the map.
Figure: Text Editor dialog box
To edit existing text, select the text
on the map and click the Edit button
( )
in the Graphics toolbar,
to open the Text Editor dialog box, where you can edit selected text.
)
in the Graphics toolbar,
to open the Text Editor dialog box, where you can edit selected text.
To
resize a graphic object, select it on the map and drag its resize
handle (![]() ) in the desired direction to
proportionally enlarge or reduce the object.
) in the desired direction to
proportionally enlarge or reduce the object.
To move a graphic object, click it and drag it to the desired position on the map.
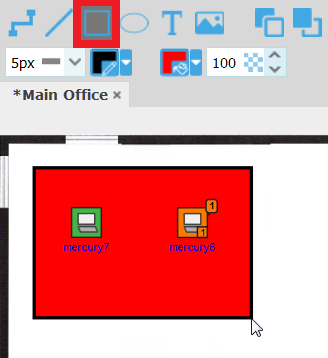
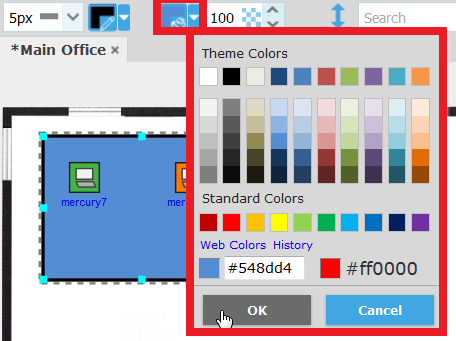
To change the fill color of a graphic object, select the object on the map and click the Fill Color button to open the Color Palette and select a different fill color from it (see the figure below).
Figure: Setting a fill color for a rectangle object
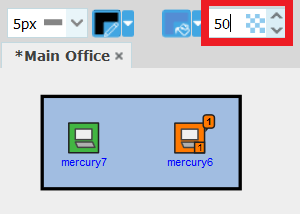
To change the opacity of the fill color of a graphic object, select the object on the map and enter the desired color opacity in percent into the Fill Color Opacity input line (see the image below).
Figure: Setting a fill color opacity for a rectangle object
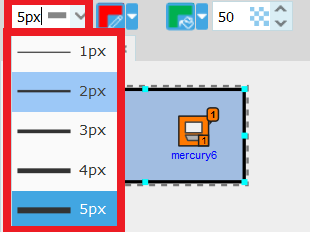
To change the line thickness of a graphic object, select the object on the map and click the Line Width button and select the desired line width from the accompanying drop-down list (see image below).
Figure: Setting a border thickness for a rectangle object
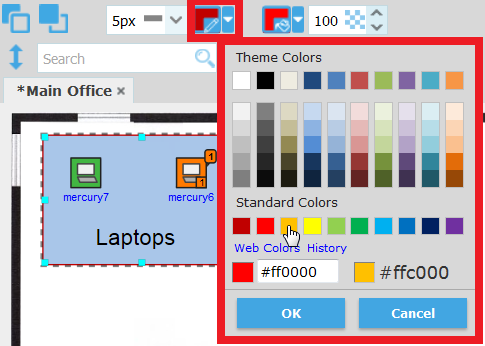
To change the line color of a graphic object, select the object on the map and click the Line Color button to open the Color Palette and select a different line color from it.
Figure: Setting a border color for a rectangle object
To
change the order (layering) of graphic objects on a map (e.g., when
objects overlap), select the desired object and click the Bring to Foreground button ( ) or Send
to Background button (
) or Send
to Background button ( ) to move the object to the top layer
or the bottom layer, respectively.
) to move the object to the top layer
or the bottom layer, respectively.
Besides devices and graphic objects, Net Inspector also lets you add cloud objects to maps. A cloud object can be used, for example, to represent a remote (cloud) network or an unmanaged portion of the network.
To
add a cloud object, select the Cloud button ( ) in the Graphics toolbar and click
the target location on a map.
) in the Graphics toolbar and click
the target location on a map.
A cloud icon is added to the map (as shown in the figure below). Cloud icons can be connected with device icons using the connection lines, as described in the Connecting Devices topic.
Figure: Cloud object on a map

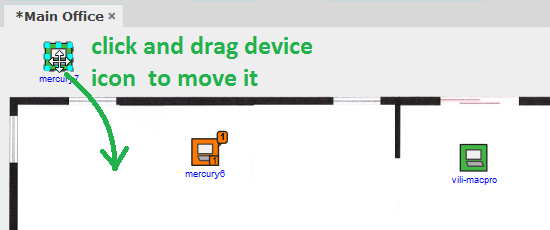
To move a device, click and drag the device icon to the desired position with the mouse (as shown in the figure below).
Figure: Repositioning a device on the map
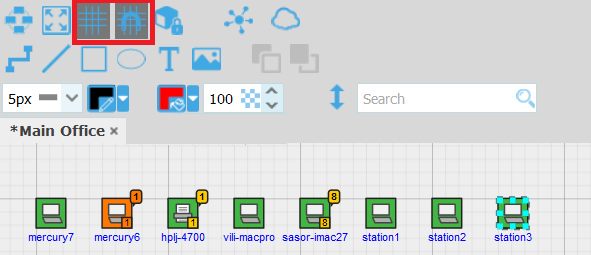
To evenly align device icons and graphic
objects on a map, click the Show
Grid button ( ) to display a gridline on the
map and the Snap
to Grid button (
) to display a gridline on the
map and the Snap
to Grid button ( ) to enable arranging
device icons and graphic elements onto a gridline (as shown
in the image below).
) to enable arranging
device icons and graphic elements onto a gridline (as shown
in the image below).
Figure: Aligning devices on a grid
To automatically
align not-connected device icons in rows, click the Relayout button ( )
in the Graphics toolbar.
If device icons are connected with connection lines, the Relayout button will rearrange them in
a different mesh topology layout.
)
in the Graphics toolbar.
If device icons are connected with connection lines, the Relayout button will rearrange them in
a different mesh topology layout.
To remove
an object or device from the map, select it and click the Remove button ( )
in the Graphics toolbar.
Note that removing device from a map will not delete this device from
the Device Panel.
)
in the Graphics toolbar.
Note that removing device from a map will not delete this device from
the Device Panel.
To connect device icons with connection lines, proceed as described in the Connecting Devices topic.
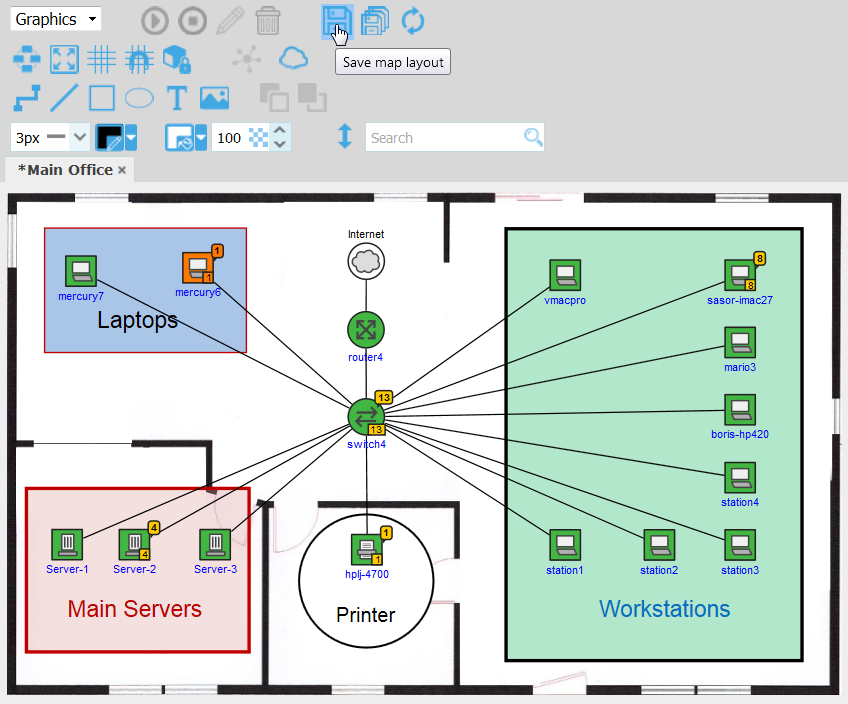
When
you have finished editing objects and the map layout, click the Save
Map Layout
button ( )
in the Graphics
toolbar
to save the changes. This saves all devices, clouds,
connections and graphic objects on the map, as well as their position
on the map. When you edit a map, an asterisk (*)
symbol appears in the tab in front of the name of the edited map.
When the map is saved, the asterisk (*)
symbol disappears.
)
in the Graphics
toolbar
to save the changes. This saves all devices, clouds,
connections and graphic objects on the map, as well as their position
on the map. When you edit a map, an asterisk (*)
symbol appears in the tab in front of the name of the edited map.
When the map is saved, the asterisk (*)
symbol disappears.
If
you have edited more than one map and not saved the changes yet, click
the Save
All Maps Layout
button ( ) in the Graphics
toolbar
to save the changes on all maps.
) in the Graphics
toolbar
to save the changes on all maps.
Figure: Saving the map layout
When finished, click the Configure toggle button (![]() )
in the upper-right section of the Devices frame to exit the Configuration Mode.
)
in the upper-right section of the Devices frame to exit the Configuration Mode.