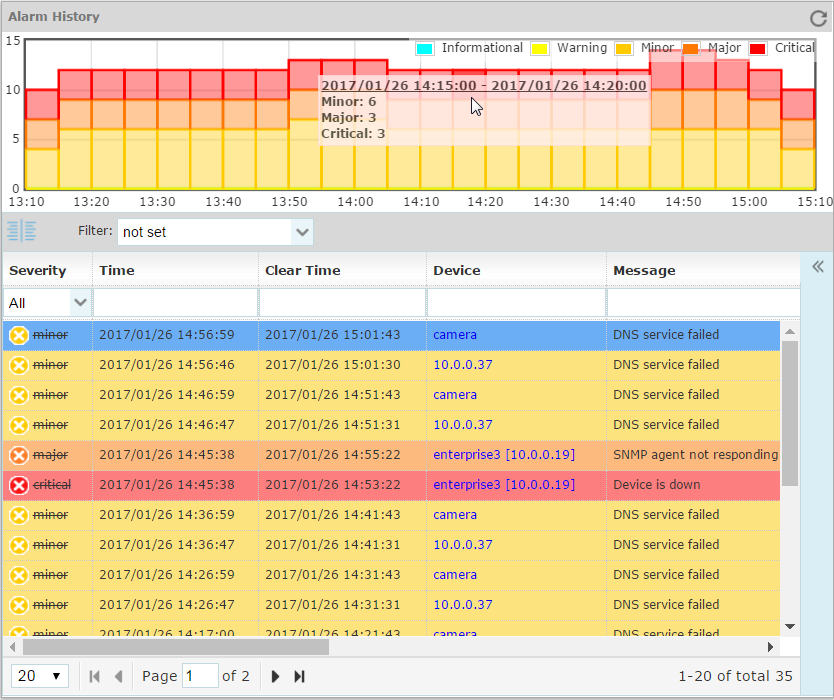
The Alarm History frame in the Alarms page displays information about the history of alarms in the given time frame. One can select the time frame in the Time Period drop-down list in the Alarms page.
Figure: Alarm History frame (hover your mouse over a bar in the stacked charts to see more information)

The Alarm History frame consists of two parts:
Stacked alarm history chart (upper section)
Alarm history list (lower section)
The stacked alarm history chart provides information about the distribution of alarms within the given time frame (e.g., Last 120 minutes, by default). A bar in the stacked chart displays the number of active alarms by severity levels within the given time slot. The width of time slots is adjustable via the Sample interval drop-down list (e.g., 5 minutes, 30 min, 1 hour, etc.). The time frame for which alarms are shown can be selected from the Time period drop-down list in the upper-right section of titlebar in the Alarms page.
The alarm history list below the stacked alarm chart displays the list of all alarms that existed in the given time frame. Some of the alarms shown may already be cleared. Cleared alarms have strike-through typeface (Severity column) and are displayed with lighter colors than active alarms, as shown in the picture above.
The information about alarms shown in the Alarm history list is the same as in the Active Alarms frame, with additional information about alarm clearing (Clear Time column and Clear details in Alarm Details sub-frame).
In the Alarm history list, you can displays/hide columns, sort and filter alarms in the same way as in the Active Alarms frame.
To zoom-in to a portion of the alarm history chart and view only related alarms, refer to the Operations Specific to Alarm History frame topic.
Subtopics: