Conversation Details Page
To view the Conversation Details page for a specific conversation, click the conversation link in the Top N Conversations frame in the NetFlow home page or in other NetFlow Details pages.
Figure: Conversation Details page
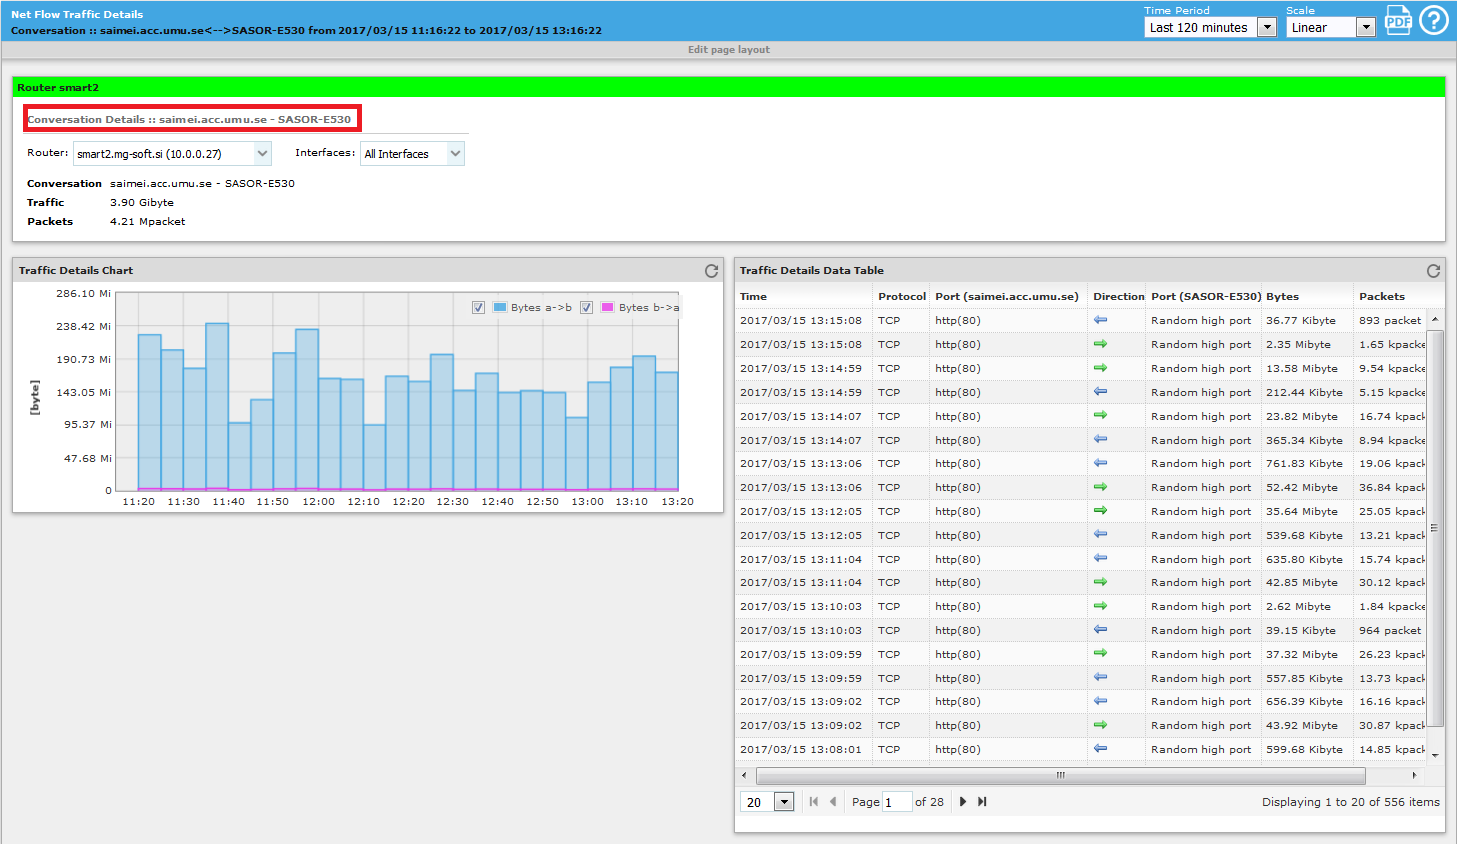
In the Conversation Details page, you can view the traffic details of the given conversation visually (in a bar graph) and numerically (in a table).
You can view the information on all interfaces of the selected router or choose the router or interface you want to focus on in the Router or Interface drop-down list.
Note: in the upper right corner of the frame, you can select the Time period and Scale value.
For the last 24 hours period, the raw data (i.e., individual flows as received from the NetFlow source), is displayed in the Traffic Details table. A flow is a unidirectional sequence of packets passed from one endpoint (IP address and port) to another. One can view the history of flows of the selected conversation in terms of bytes and packets transferred in both directions.
The Traffic Details Chart always displays aggregated NetFlow data. For example, if the selected time period does not exceed 2 days (for example, if you select “This hour”, “Last 60 minutes”, “Last hour”, “Last 120 minutes”, “Today”, or “Yesterday” option from the Time period drop-down list), the graph displays 5-minute sum bars. The 5-minute sum bars show how many bytes* of data have been transferred in each direction between two endpoints in 5 minute intervals spread across the selected time frame.
* Or kibibytes (=210 bytes), or mebibytes (=220 bytes), or gibibytes (=230 bytes), etc.
To zoom in into a specific portion of the graph, select the desired portion of the graph with your mouse (click and drag the mouse cursor over the desired portion of the graph).
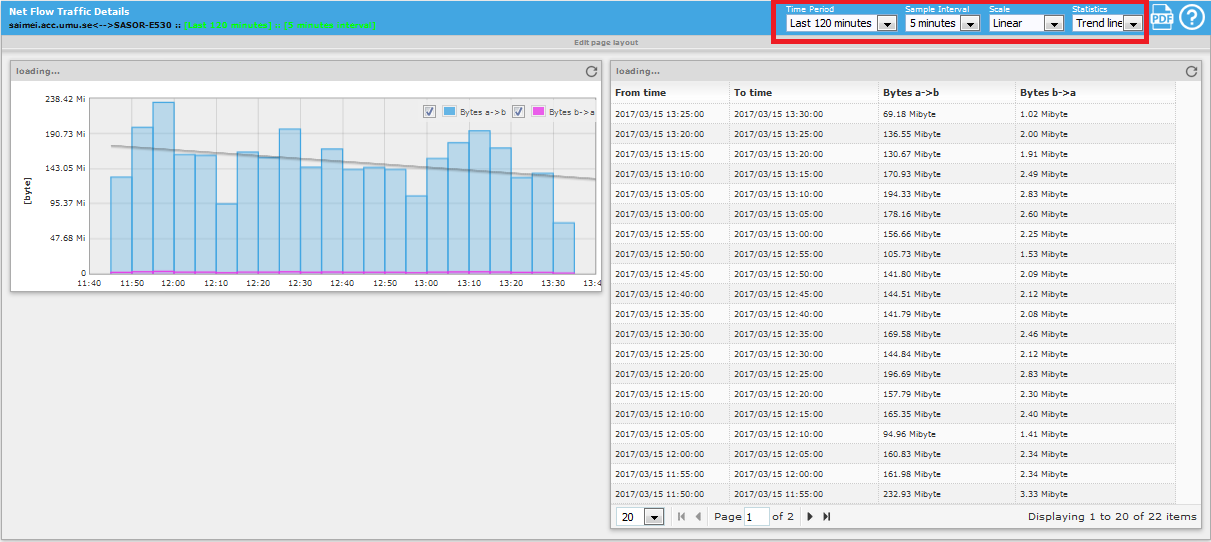
To be able to view a trend line or 95-percentile line or set a different sample interval or a custom time period for the graph, click the graph to display the dedicated page where all these settings can be selected from the drop-down lists in the upper right section of the page titlebar (see the figure below).
Figure: Conversation Details page - viewing a trend line in the chart and 5-minute data sums in the table