NetFlow Home Page
To view the NetFlow home page, click the NetFlow tab in the main page (Figure).
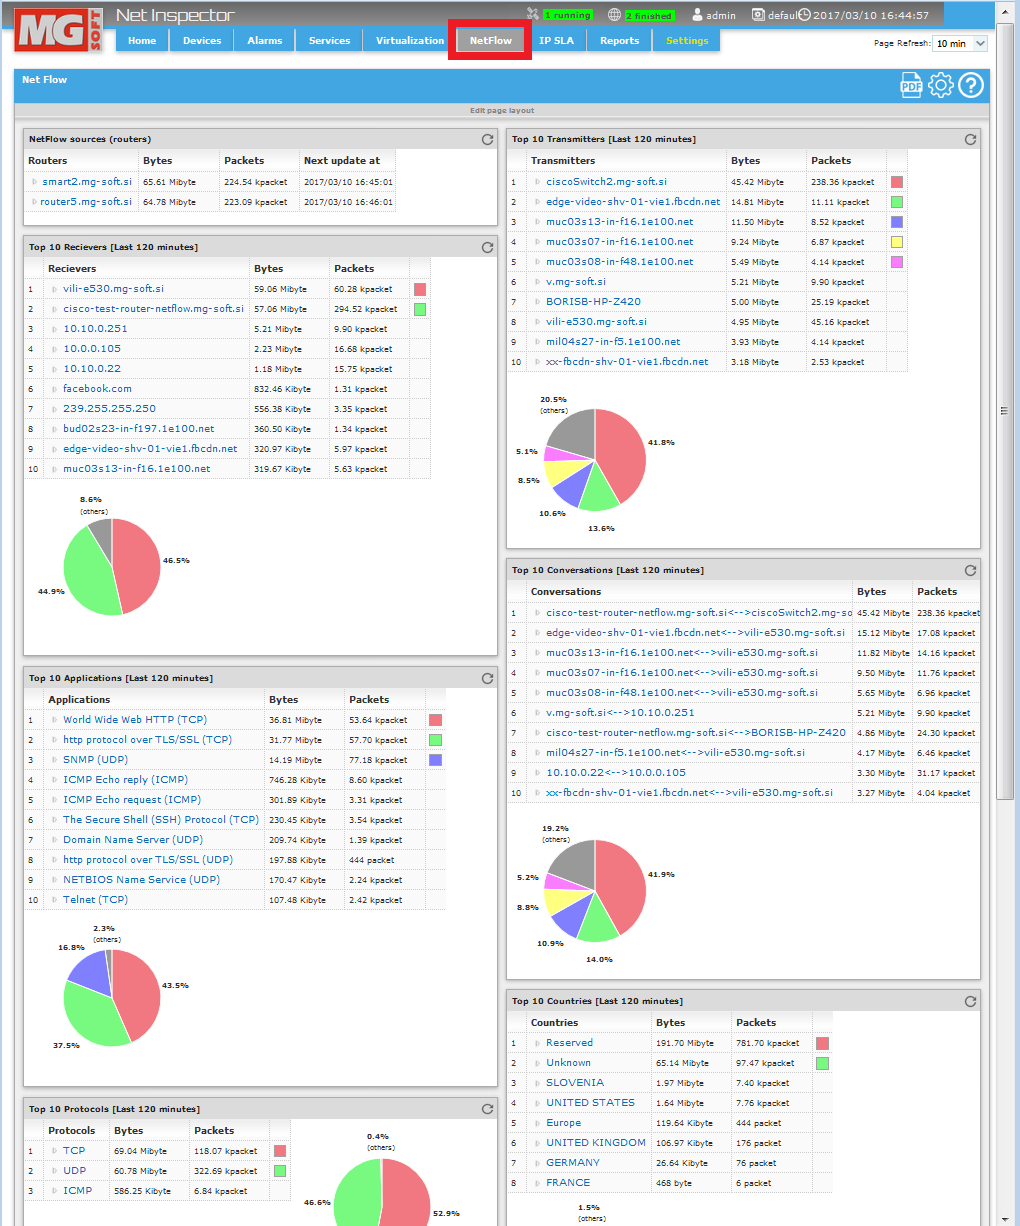
The NetFlow home page displays all NetFlow and sFlow source devices (in the NetFlow Sources frame) and consolidated Top N NetFlow/sFlow traffic reports for a specific (configurable) time period. The consolidated Top N reports are calculated from the data reported by all devices listed in the NetFlow Sources frame.
The following Top N (N is configurable, i.e., 5, 10, 15, 20) NetFlow reports are displayed (a chart and an ordered list is shown in each report):
Top N Receivers: Displays the N receivers (hosts) that received the most data.
Top N Transmitters: Displays the N transmitters (hosts) that sent the most data.
Top N Transceivers: Displays the N transceivers (hosts) that sent and received the most data.
Top N Conversations: Displays the N conversations (traffic between two endpoints) that transferred the most data.
Top N Applications: Displays the N applications that transferred the most data.
Top N Protocols: Displays the top N protocols that transferred the most data.
Top N Countries: Displays the top N countries that transferred the most data.
Note 1: By default the NetFlow home page displays NetFlow data for the last 60 minutes time period. Administrators can configure the time period and the N value for Top N reports in the NetFlow/sFlow Configuration dialog box.
Note 2: Net Inspector NetFlow report pages display the NetFlow/sFlow traffic information in terms of bytes and packets.
The units for bytes are: bytes, or kibibytes (=210 bytes), or mebibytes (=220 bytes), or gibibytes (=230 bytes), etc.
The units for packets are: packets, or kilopackets, or megapackets, etc.
Figure:The NetFlow home page displays consolidated NetFlow/sFlow reports
By click an item (link) in the NetFlow home page, you will be redirected to the web page displaying more details about the selected item (router, interface, conversation, application, country, protocol or endpoint), as follows:
By clicking a router link in the NetFlow Sources frame, the Router Details page is displayed,
By clicking an interface link in the NetFlow Sources frame, the Interface Details page is displayed,
By clicking a conversation link in the Top N Conversations frame, the Conversation Details page is displayed,
By clicking an application link in the Top N Applications frame, the Application Details page is displayed,
By clicking a country link in the Top N Countries frame, the Country Details page is displayed,
By clicking a protocol link in the Top N Protocols frame, the Protocol Details page is displayed,
By clicking a protocol link in the Top N Receivers and Top N Transmitters frame, the Endpoint Details page is displayed.
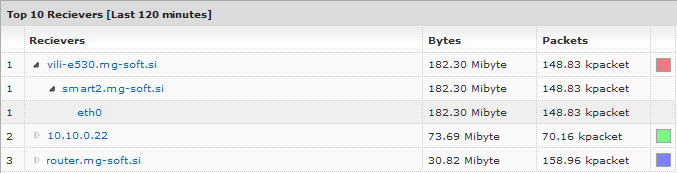
All link items in the NetFlow home page have sub-items that provide information about the source of the flow, i.e., the router/switch and interface over which the flow was transmitted.
Click
the expand button (![]() )
in front of the desired item (e.g., a receiver, transmitter, conversation,
application, etc.) to view information about the router and interface(s)
over which the given traffic was transmitted (as shown in the figure
below).
)
in front of the desired item (e.g., a receiver, transmitter, conversation,
application, etc.) to view information about the router and interface(s)
over which the given traffic was transmitted (as shown in the figure
below).
Figure: Expanding a receiver item in the Top N Receivers frame, to view the router and interface over which this receiver transmitted the reported traffic (flow)
By clicking on the router link or the interface link in the expanded item view (e.g., receiver), you will be redirected to that item details page filtered by the given router or router+interface, respectively.