To open the Interface
Details Page click the expand button ( ) in front of
the device (e.g., router) in the NetFlow home
page, to show
the list of monitored interfaces, then click the name of the interface
whose traffic you want to view (as
shown in the figure below). Alternatively, select the interface
from the drop-down list in the Router
Details Page.
) in front of
the device (e.g., router) in the NetFlow home
page, to show
the list of monitored interfaces, then click the name of the interface
whose traffic you want to view (as
shown in the figure below). Alternatively, select the interface
from the drop-down list in the Router
Details Page.
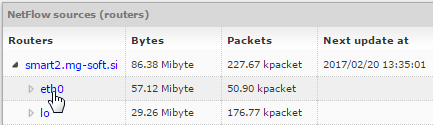
Figure: Selecting an interface in the NetFlow home page
The Interface Details page opens, as shown below.
Figure: The Interface Details page
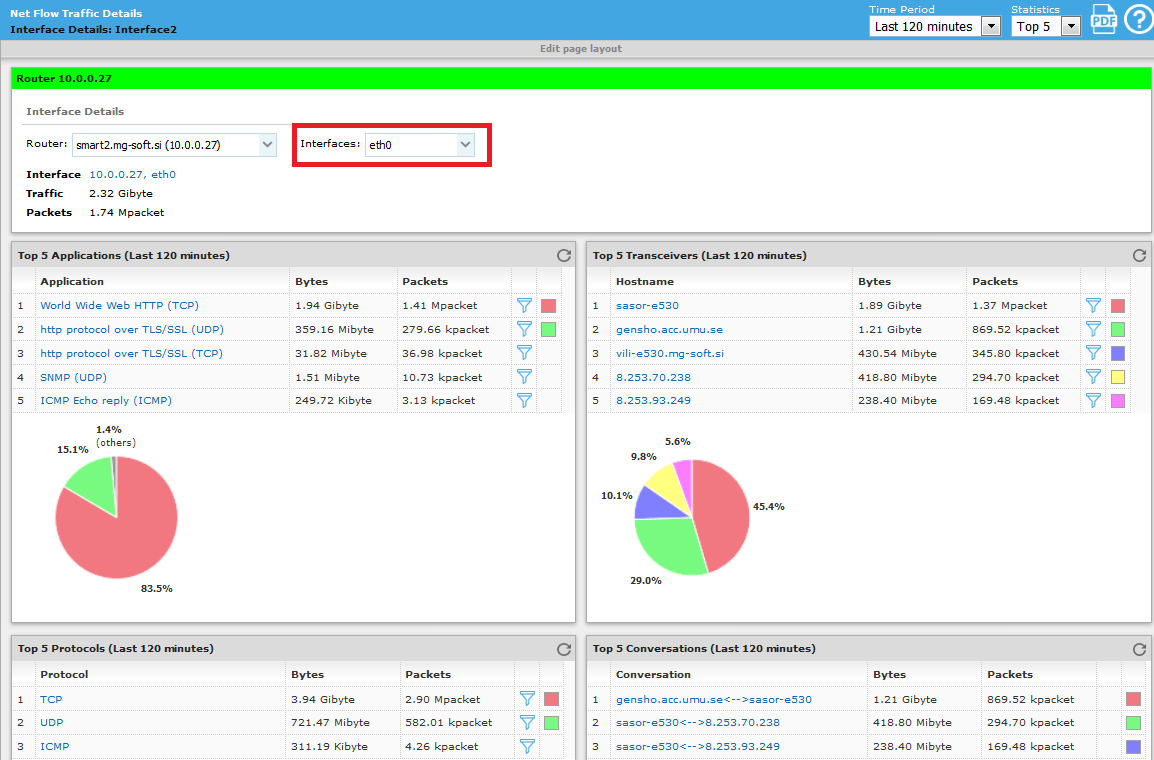
On this page, you can monitor the traffic information on a specific network interface on the given router. The information is split into several groups:
Top N Transceivers,
Top N Applications,
Top N Conversations,
Top N Protocols and
Top N Countries.
Note: in the upper right corner of the frame, you can select the time period, graph (bar or pie), and the N value for all Top N reports displayed in this page.
Use the filters to filter (drill-down) the given NetFlow Details page by one or more parameters (e.g., endpoint, application, protocol, etc.), as described in the Using Filters in NetFlow Details Pages topic.
If you click on the name of an item, you will be redirected to the corresponding page (Endpoint Details page if the item is a transceiver, Application Details page if the item is an application, etc.) displaying information related to that item on the given router and interface.