Administrators may configure parameters that control device polling. These parameters are grouped into two types of profiles:
Access profiles
An access profile contains SNMP, WMI and VMware protocol parameters for accessing monitored devices via the respective protocols (which of the three protocols will be used for monitoring a given device is determined by the Protocol setting in the polling profile assigned to the same device).
Polling profiles
A polling profile contains parameters that control which protocols (e.g., ICMP, SNMP, WMI, VMware, etc.) will be used for polling devices, what categories of parameters will be polled (e.g., interfaces, memory, CPU, disks, etc.) and how often (polling intervals). A polling profile also lets you set thresholds for triggering and clearing alarms and configure alarm delays.
This section describes how to configure and manage polling profiles. For instructions on managing access profiles, refer to the Configuring Access Profiles topic.
Once a new polling profile is created, it can be assigned to a monitored device in the respective Edit Device Monitoring Options dialog box.
Note: Only users with administrator access rights are permitted to configure settings described in this topic.
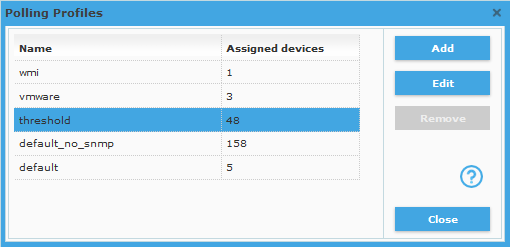
Select the Settings / Polling Profiles command to open the Polling Profiles dialog box (as shown in the image below).
Figure: Polling Profiles dialog box
The Polling Profiles dialog box is used for managing polling profiles. This dialog box also displays the number of devices that have individual polling profiles assigned.
To create a new polling profile, click the Add button in the Polling Profiles dialog box. This opens the New Polling Profile dialog box (as shown in the figure below).
To edit an existing polling profile, select it in the Polling Profiles dialog box and click the Edit button. This opens the Edit Polling Profile dialog box, which has the same appearance as the New Polling Profile dialog box.
To delete an existing polling profile, select it in the Polling Profiles dialog box and click the Remove button. Profiles that are currently in use (=assigned to devices) cannot be deleted.
In the Polling Profiles dialog box, click the Add or Edit button, to open the New/Edit Polling Profile dialog box (shown below).
Figure: New/Edit Polling Profile dialog box
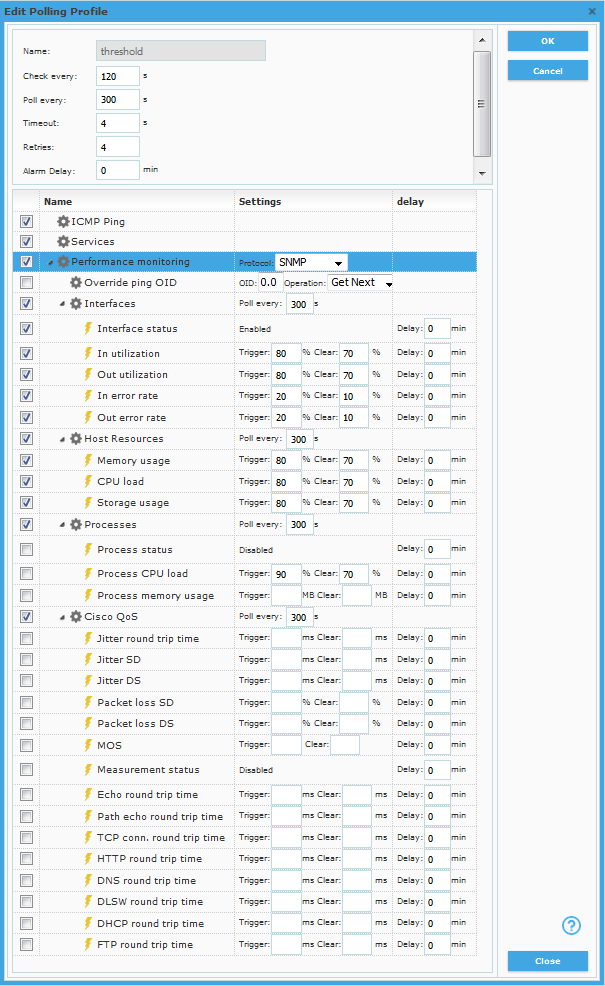
In the New/Edit Polling Profile dialog box, specify the following settings:
Upper frame:
Name (input line)
The name of the polling profile. This is a label under which all the settings in this dialog are saved.
Check every (input line)
Specifies the interval in seconds for ping polling (i.e., checking if a device is responding)
Specifies the interval in seconds for polling network services (HTTP, IMAP, DNS; SSH, etc.). This setting also sets the interval for polling device basic system information through SNMP, WMI and VMware.
Timeout (input line)
Specifies the timeout value in seconds. This value determines how long Net Inspector polling engine will wait for a response to each SNMP and ICMP Echo request it sends to the managed object, before generating a timeout interrupt signal.
Retries (input line)
Specifies the number of times the SNMP and ICMP Echo request will be retransmitted after the first timeout occurs.
Alarm delay (input line)
Specifies the device status alarm delay in minutes. This value determines for how long Net Inspector will wait before reporting detected device status alarms (Device is down, SNMP agent not responding, WMI not responding, VMware not responding), provided that these alarms do not get cleared in the meantime. If a detected status alarm is cleared during the alarm delay interval, the alarm will never be reported. This can be used, for example, to prevent reporting the mentioned alarms when a device is rebooted. If alarm delay is set to zero, these alarms will be reported immediately when detected (without delay).
Lower frame:
ICMP Ping (checkbox)
If this checkbox is checked, the ICMP Echo (ping) polling is enabled.
If this checkbox is checked, the monitoring of network services is enabled. If monitoring of network services is enabled, each monitored device is automatically scanned for the supported network services and detected services are automatically monitored. The collected information will be displayed in the Services frame in the Device performance page and in the Services page.
Performance Monitoring (checkbox) and Protocol (drop-down list)
If this checkbox is checked, the device performance monitoring is enabled. The performance parameters will be polled by using the protocol selected in the accompanying Protocol drop-down list. Supported protocols are:
SNMP (Simple Network Management Protocol),
WMI (Windows Management Instrumentation),
VMware (VMware web service using VMware vSphere API).
The actual parameters / credentials used for accessing monitored device via the selected protocol (SNMP, WMI, or VMware) are specified in the access profile assigned to the given device.
The checkboxes below determine what information besides the basic system information will be monitored (e.g., network interfaces, resources, processes, etc.):
Override ping OID (checkbox, input line and drop-down list)
If this checkbox is checked, the default “SNMP Ping” parameters can be overridden. “SNMP Ping” operation is used to monitor the status (availability) of the SNMP agent on the managed device. By default, this is achieved by periodically querying it with SNMP GetNext requests containing the 0.0 OID (this mechanism retrieves the value of the first accessible OID that lexicographically follows the OID of 0.0). If you would like some other OID to be queried or use the SNMP Get operation instead, check the Override ping OID checkbox and enter the desired OID into the OID input line and select the SNMP operation (GetNext or Get) to be used for retrieving this OID from the Operation drop-down list.
Interfaces (checkbox and input line)
If this checkbox is checked, the network interfaces on devices will be monitored. In the accompanying Poll every input line enter the polling interval (in seconds) for monitoring network interface statistics. Furthermore, you can set the threshold values for triggering and clearing alarms associated with interfaces and set the corresponding alarm reporting delays.
The collected information will be displayed in the Interfaces frame in the Device performance page.
Interface status (checkbox and input line)
If this checkbox is checked, Net Inspector monitors the status network interfaces on the device and triggers alarm if any of the interfaces goes down without being administratively disabled. The alarm is automatically cleared when the interface comes up again. The accompanying Delay input line lets you set the delay for reporting the corresponding alarm in minutes (zero value disables the delay).
In utilization (checkbox and input lines)
If this checkbox is checked, you can enter the interface inbound utilization threshold values (in %) into the accompanying Trigger and Clear input lines. This way, Net Inspector will trigger an alarm when the interface inbound utilization rate exceeds the configured value for triggering the alarm (Trigger input line) and clear the alarm when the same utilization rate falls below the clear alarm threshold value (Clear input line). The accompanying Delay input line lets you set the delay for reporting the corresponding alarm in minutes (zero value disables the delay).
Out utilization (checkbox and input lines)
If this checkbox is checked, you can enter the interface outbound utilization threshold values (in %) into the accompanying input lines. This way, Net Inspector will trigger an alarm when the interface outbound utilization rate exceeds the configured value for triggering the alarm (Trigger input line) and clear the alarm when the same utilization rate falls below the clear alarm threshold value (Clear input line). The accompanying Delay input line lets you set the delay for reporting the corresponding alarm in minutes (zero value disables the delay).
In error rate (checkbox and input lines)
If this checkbox is checked, you can enter the interface inbound error rate threshold values (in %) into the accompanying input lines. This way, Net Inspector will trigger an alarm when the interface inbound error rate exceeds the configured value for triggering the alarm (Trigger input line) and clear the alarm when the error rate falls below the clear alarm threshold value (Clear input line). The accompanying Delay input line lets you set the delay for reporting the corresponding alarm in minutes (zero value disables the delay).
Out error rate (checkbox and input lines)
If this checkbox is checked, you can enter the interface outbound error rate threshold values (in %) into the accompanying input lines. This way, Net Inspector will trigger an alarm when the interface outbound error rate exceeds the configured value for triggering the alarm (Trigger input line) and clear the alarm when the error rate falls below the clear alarm threshold value (Clear input line). The accompanying Delay input line lets you set the delay for reporting the corresponding alarm in minutes (zero value disables the delay).
Host Resources (checkbox and input line)
If this checkbox is checked, the utilization of device system resources, like the memory usage, CPU load, and disk usage will be monitored (if the device supports it). In the accompanying Poll every input line enter the polling interval (in seconds) for monitoring host resources statistics. Furthermore, you can set the threshold values for triggering and clearing alarms associated with the system resource utilization and set the corresponding alarm reporting delays.
The collected information will be displayed in the Memory and Processor Info frame and in the in the Storage Info frame in the Device performance page.
Memory usage (checkbox and input lines)
If this checkbox is checked, you can enter the device memory usage threshold values (in %) into the accompanying Trigger and Clear input lines. This way, Net Inspector will trigger an alarm when the device memory usage exceeds the configured value for raising the alarm (Trigger input line) and clear the alarm when the memory usage falls below the clear alarm threshold value (Clear input line). The accompanying Delay input line lets you set the delay for reporting the corresponding alarm in minutes (zero value disables the delay).
CPU load (checkbox and two input lines)
If this checkbox is checked, you can enter the device CPU load threshold values (in %) into the accompanying input lines. This way, Net Inspector will trigger an alarm when the device CPU load exceeds the configured value for raising the alarm (Trigger input line) and clear the alarm when the CPU load falls below the clear alarm threshold value (Clear input line). The accompanying Delay input line lets you set the alarm reporting delay in minutes (zero value disables the delay).
Storage usage (checkbox and two input lines)
If this checkbox is checked, you can enter the device data storage unit usage threshold values (in %) into the accompanying input lines. This way, Net Inspector will trigger an alarm when the device storage usage exceeds the configured value for raising the alarm (Trigger input line) and clear the alarm when the storage usage falls below the clear alarm threshold value (Clear input line). The accompanying Delay input line lets you set the alarm reporting delay in minutes (zero value disables the delay).
Processes (checkbox and input line)
If this checkbox is checked, the processes running on devices will be monitored (via SNMP or WMI). The process information, i.e., process name, running status, process memory usage and process CPU usage, will be displayed only for the selected processes. Into the accompanying Poll every input line enter the polling interval (in seconds) for monitoring processes. Furthermore, you can set the threshold values for triggering and clearing alarms associated with the process status and resources consumption and set the corresponding alarm reporting delays.
Collected information will be displayed in the Processes frame in the Device performance page.
Process status (checkbox and input line)
If this checkbox is checked, Net Inspector monitors the status of processes on the given managed object and triggers an alarm if any of the processes stop running. The alarm is automatically cleared when the process is running again. The accompanying Delay input line lets you set the alarm reporting delay in minutes (zero value disables the delay).
Process CPU load (checkbox and input lines)
If this checkbox is checked, you can enter the processes CPU load threshold values (in %) into the accompanying input lines. This way, Net Inspector will trigger an alarm when the processes CPU load exceeds the configured value for raising the alarm (Trigger input line) and clear the alarm when the CPU load falls below the clear alarm threshold value (Clear input line). The accompanying Delay input line lets you set the alarm reporting delay in minutes (zero value disables the delay).
Process memory (checkbox and input lines)
If this checkbox is checked, you can enter the processes memory usage threshold values (in MB) into the accompanying input lines. This way, Net Inspector will trigger an alarm when the processes memory usage exceeds the configured value for raising the alarm (Trigger input line) and clear the alarm when the memory usage falls below the clear alarm threshold value (Clear input line). The accompanying Delay input line lets you set the alarm reporting delay in minutes (zero value disables the delay).
IP SLA (checkbox and input line)
If this checkbox is checked, the IP SLA statistics will be monitored on Cisco routers that are properly configured and provide this information via SNMP. Into the accompanying Poll every input line enter the polling interval (in seconds) for monitoring IP SLA statistics. Furthermore, you can set the threshold values for triggering and clearing alarms associated with the IP SLA metrics and set the corresponding alarm reporting delays.
Collected information will be displayed in the IP SLA page in the Device performance page and in the IP SLA page.
For more information on configuring IP SLA operations on Cisco devices, please consult the Cisco documentation
(e.g.: http://www.cisco.com/en/US/docs/ios/12_4/ip_sla/configuration/guide/hsoverv.html).
Jitter round trip time (checkbox and input lines)
If this checkbox is checked, the IP SLA VoIP Jitter round trip time threshold is enabled.
Jitter is the variation in delay between arriving packets (inter-packet delay variance). Jitter affects voice quality by causing uneven gaps in the speech pattern of the person talking.
Enter the Jitter round trip time threshold values (in ms) into the accompanying input lines. This way, Net Inspector will trigger an alarm when the Jitter round trip time exceeds the configured value for raising the alarm (Trigger input line) and clear the alarm when the round trip time falls below the clear alarm threshold value (Clear input line). The accompanying Delay input line lets you set the alarm reporting delay in minutes (zero value disables the delay).
Jitter SD (checkbox and two input lines)
If this checkbox is checked, the VoIP source-to-destination jitter threshold is enabled. This applies to one-way jitter measured from source to destination router. Enter the source-to-destination jitter threshold values (in ms) into the accompanying input lines. This way, Net Inspector will trigger an alarm when the source-to-destination jitter (as measured by the IP SLAs) exceeds the configured value for raising the alarm (Trigger input line) and clear the alarm when the source-to-destination jitter falls below the clear alarm threshold value (Clear input line). The accompanying Delay input line lets you set the alarm reporting delay in minutes (zero value disables the delay).
Jitter DS (checkbox and two input lines)
If this checkbox is checked, the VoIP destination-to-source jitter threshold is enabled.
Enter the destination-to-source jitter threshold values (in ms) into the accompanying input lines. This way, Net Inspector will trigger an alarm when the destination-to-source jitter (as measured by the IP SLAs) exceeds the configured value for raising the alarm (Trigger input line) and clear the alarm when the destination-to-source jitter falls below the clear alarm threshold value (Clear input line). The accompanying Delay input line lets you set the alarm reporting delay in minutes (zero value disables the delay).
Packet loss SD (checkbox and two input lines)
If this checkbox is checked, the VoIP source-to-destination packet loss threshold is enabled. This applies to one-way packet loss from source to destination router.
Enter the source-to-destination packet loss threshold values (in %) into the accompanying input lines. This way, Net Inspector will trigger an alarm when the source-to-destination packet loss (as measured by the IP SLAs) exceeds the configured value for raising the alarm (Trigger input line) and clear the alarm when the source-to-destination packet loss falls below the clear alarm threshold value (Clear input line). The accompanying Delay input line lets you set the alarm reporting delay in minutes (zero value disables the delay).
Packet loss DS (checkbox and two input lines)
If this checkbox is checked, the VoIP destination-to-source packet loss threshold is enabled. This applies to one-way packet loss from destination to source router.
Enter the destination-to-source packet loss threshold values (in %) into the accompanying input lines. This way, Net Inspector will trigger an alarm when the destination-to-source packet loss (as measured by the IP SLAs) exceeds the configured value for raising the alarm (Trigger input line) and clear the alarm when the destination-to-source packet loss falls below the clear alarm threshold value (Clear input line). The accompanying Delay input line lets you set the alarm reporting delay in minutes (zero value disables the delay).
MOS (checkbox and two input lines)
If this checkbox is checked, the IP SLA VoIP mean opinion score (MOS) threshold is enabled.
Mean Opinion Score (MOS) is a numerical indication of the perceived quality of sound after compression and transmission. Cisco routers with enabled IP SLAs VoIP UDP jitter operation will calculate and express the estimated MOS value as a number in the range of 1 to 5, where 1 is the lowest audio quality, and 5 is the highest quality. A MOS value of zero indicates that MOS data is not available.
Enter the MOS threshold values into the accompanying input lines. This way, Net Inspector will trigger an alarm when the MOS (as measured by the IP SLAs) falls bellow the trigger alarm threshold value (Trigger input line) and clear the alarm when it raises again above the clear alarm threshold value (Clear input line). The accompanying Delay input line lets you set the alarm reporting delay in minutes (zero value disables the delay).
Measurement status (checkbox and input line)
If this checkbox is checked, Net Inspector monitors the measurement status of all enabled IP SLA services on the given device and triggers an alarm, if any enabled service is down. The alarm is automatically cleared when the service is up again. The accompanying Delay input line lets you set the alarm reporting delay in minutes (zero value disables the delay).
Echo round trip time (checkbox and input lines)
If this checkbox is checked, the ICMP echo round trip time threshold is enabled.
Enter the echo round trip time threshold values (in ms) into the accompanying input lines. This way, Net Inspector will trigger an alarm when the echo round trip time exceeds the configured value for raising the alarm (Trigger input line) and clear the alarm when the round trip time falls below the clear alarm threshold value (Clear input line). The accompanying Delay input line lets you set the alarm reporting delay in minutes (zero value disables the delay).
Path echo round trip time (checkbox and input lines)
If this checkbox is checked, the full path echo round trip time threshold is enabled.
Enter the full path echo round trip time threshold values (in ms) into the accompanying input lines. This way, Net Inspector will trigger an alarm when the full path echo round trip time exceeds the configured value for raising the alarm (Trigger input line) and clear the alarm when the round trip time falls below the clear alarm threshold value (Clear input line). The accompanying Delay input line lets you set the alarm reporting delay in minutes (zero value disables the delay).
TCP connect round trip time (checkbox and input lines)
If this checkbox is checked, the IP SLA TCP connect round trip time threshold is enabled.
Enter the TCP connect round trip time threshold values (in ms) into the accompanying input lines. This way, Net Inspector will trigger an alarm when the TCP connect round trip time exceeds the configured value for raising the alarm (Trigger input line) and clear the alarm when the round trip time falls below the clear alarm threshold value (Clear input line). The accompanying Delay input line lets you set the alarm reporting delay in minutes (zero value disables the delay).
HTTP round trip time (checkbox and input lines)
If this checkbox is checked, the IP SLA HTTP round trip time threshold is enabled.
Enter the HTTP round trip time threshold values (in ms) into the accompanying input lines. This way, Net Inspector will trigger an alarm when the HTTP round trip time exceeds the configured value for raising the alarm (Trigger input line) and clear the alarm when the round trip time falls below the clear alarm threshold value (Clear input line). The accompanying Delay input line lets you set the alarm reporting delay in minutes (zero value disables the delay).
DNS round trip time (checkbox and input lines)
If this checkbox is checked, the IP SLA DNS round trip time threshold is enabled.
Enter the DNS round trip time threshold values (in ms) into the accompanying input lines. This way, Net Inspector will trigger an alarm when the DNS round trip time exceeds the configured value for raising the alarm (Trigger input line) and clear the alarm when the round trip time falls below the clear alarm threshold value (Clear input line). The accompanying Delay input line lets you set the alarm reporting delay in minutes (zero value disables the delay).
DLSW round trip time (checkbox and input lines)
If this checkbox is checked, the IP SLA DLSW (Data Link Switching Plus) round trip time threshold is enabled.
Enter the DLSW round trip time threshold values (in ms) into the accompanying input lines. This way, Net Inspector will trigger an alarm when the DLSW round trip time exceeds the configured value for raising the alarm (Trigger input line) and clear the alarm when the round trip time falls below the clear alarm threshold value (Clear input line). The accompanying Delay input line lets you set the alarm reporting delay in minutes (zero value disables the delay).
DHCP round trip time (checkbox and input lines)
If this checkbox is checked, the IP SLA DHCP round trip time threshold is enabled.
Enter the DHCP round trip time threshold values (in ms) into the accompanying input lines. This way, Net Inspector will trigger an alarm when the DHCP round trip time exceeds the configured value for raising the alarm (Trigger input line) and clear the alarm when the round trip time falls below the clear alarm threshold value (Clear input line). The accompanying Delay input line lets you set the alarm reporting delay in minutes (zero value disables the delay).
FTP round trip time (checkbox and input lines)
If this checkbox is checked, the IP SLA FTP round trip time threshold is enabled.
Enter the FTP round trip time threshold values (in ms) into the accompanying input lines. This way, Net Inspector will trigger an alarm when the FTP round trip time exceeds the configured value for raising the alarm (Trigger input line) and clear the alarm when the round trip time falls below the clear alarm threshold value (Clear input line). The accompanying Delay input line lets you set the alarm reporting delay in minutes (zero value disables the delay).
After you have configured the polling profile settings above, click the OK button in the upper-right section of the New/Edit Polling Profile dialog box to close it and save all the changes.
If you have created a new polling profile, its name appears in the Polling Profiles dialog box. Click the Close button in the lower-right section of Polling Profiles dialog box to close it.
Tip 1: Once you have configured a new polling profile, you can assign it to a monitored device in the Edit Device Monitoring Options dialog box.
Tip
2: To
quickly assign a polling profile to two or more devices, select the
devices in the Devices page (Map View
frame), and click
the Edit
Device button (![]() )
in the Map View frame toolbar. This opens the Edit Device Monitoring
Options dialog box.
Select the desired polling profile from the Polling profile drop-down list
and click the OK button to apply
the change for all selected devices.
)
in the Map View frame toolbar. This opens the Edit Device Monitoring
Options dialog box.
Select the desired polling profile from the Polling profile drop-down list
and click the OK button to apply
the change for all selected devices.